EngageNY
Calculating Probabilities of Compound Events
Use tree diagrams with multiple branches to calculate the probabilities of compound events. Pupils use tree diagrams to find the sample space for probability problems and use them to determine the probability of compound events in the...
Curated OER
7-5 Practice Integration: Probability Compound Events
For this probability worksheet, students read story problems and draw tree diagrams to model the probability of compound events. After creating two tree diagrams, students compare them. They compute the probability of dependent events.
Project Maths
Outcomes of Coin Tosses
Flip a coin: heads, use the resource; tails, use the resource. The fourth of six installments of the Statistics & Probability unit looks at coin tosses and probability. The class conducts an experiment and sees that the outcomes of...
Curated OER
Concept: Dependent Events
Middle and high schoolers determine the probability of dependent events. Students compute both compound and simple probability. This four-page worksheet contains six multi-step problems.
Illustrative Mathematics
Waiting Times
Probability prevails in this assignment as youngsters determine the probability of finding a blue pen in a cereal box when they can come in blue, green, yellow, or red. Learners set up a simulation to determine the outcome of compound...
EngageNY
Events and Venn Diagrams
Time for statistics and learning to overlap! Learners examine Venn Diagrams as a means to organize data. They then use the diagrams to calculate simple and compound probabilities.
Curated OER
Conditional Probability and Probability of Simultaneous Events
Students explore the concept of conditional probability and probability of simultaneous events. In this conditional probability and probability of simultaneous events lesson, students roll dice or use and applet to roll dice to determine...
EngageNY
Using Tree Diagrams to Represent a Sample Space and to Calculate Probabilities
Cultivate the tree of knowledge using diagrams with two stages. Pupils create small tree diagrams to determine the sample space in compound probability problems. The instructional activity uses only two decision points to introduce tree...
EngageNY
Applying Probability to Make Informed Decisions
Use simulations to determine the probabilities of events to make decisions. Class members are presented with several scenarios, some with known probabilities and others without. Groups run simulations to gather data that they then...
Curated OER
Introduction to the Concept of Probability
Middle and high schoolers have a clarified definition of probability, they explore about outcomes in probability and how to calculate experimental probability. They use computers to learn about probability.
Curated OER
What are the Odds
Students predict the-outcome of an event. In this algebra lesson, students compare and contrast the probability of an event occurring. They calculate the odds of a simple event and make estimation.
Math12
Basics of Probability
Give your middle schoolers a fighting chance at understanding probability. Offering numerous examples that clearly demonstrate basic probability concepts, this resource helps young mathematicians learn how to visualize the...
Mathalicious
Three Shots
To foul or not to foul, that is the basketball question. High schoolers look at the probability that fouling out a player and allowing free throws yields a better outcome than allowing the original shot. The resource provides a...
Curated OER
Probabilities for Number Cubes
Students explore the concept of probability. In this probability lesson, students roll a six-sided number cube and record the frequency of each outcome. Students graph their data using a frequency chart and keep tally marks...
Illustrative Mathematics
Return to Fred's Fun Factory (with 50 Cents)
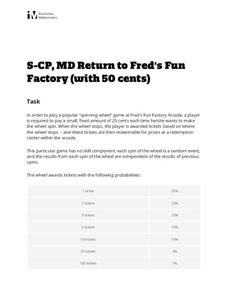
The penny arcade gets the statistics treatment in this fun probability investigation. A non-standard game of chance is described and then the class is set loose to find missing probabilities, determine common outcomes, and evaluate...
Pennsylvania Department of Education
Equally Likely and Unequally Likely Outcomes
Learners explore probability. In this statistics/probability lesson, students compare experimental and theoretical probability and use experimental probability to make predictions and conjectures. Learners explore the...
Virginia Department of Education
What Are the Chances?
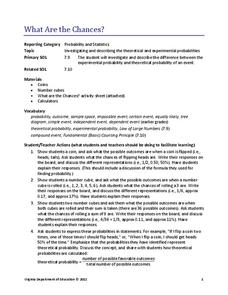
Take a chance on an informative resource. Scholars conduct probability experiments involving coins and number cubes to generate data. Compiling class data helps connect experimental probability to theoretical probability.
Curated OER
Real-World Probability
Learners explore the concept of probability. In this probability lesson, students create a video, poster, or podcast explaining what experiments, sample space, events, and outcomes are in relation to probability. Learners...
Curated OER
Who? What? When? Where? Asking Questions
Sixth graders interview Veterans or role play to answer who, what, where, when questions. In this Veteran's Day questioning activity, 6th graders learn about the events in the military service of veterans. Students may simulate...
Western Kentucky University
Understanding Genetics: Punnett Squares
Can scientists really predict genetic outcomes or are they simply making a lucky guess? Scholars first learn about Gregor Mendel and how to make Punnett squares. Then they extract DNA from a strawberry in a lab with included conclusion...
Curated OER
Ideas that Lead to Probability
Students explore the concept of probability. In this probability lesson, students use random number generators to determine probabilities of events. Students discuss if certain probable events are fair. Students determine fair ways to...
NASA
Melting Ice: Designing an Experiment
Sometimes, despite the best laid plans, the unexpected will occur. Learners witness this firsthand as they carefully design an experiment to determine the time needed for ice to melt in salt water or pure water. They uncover facts not...
Virginia Department of Education
The Real Meal Deal
Burgers and salads and sodas, oh my! Scholars use a menu to investigate the Fundamental Counting Principle. They create tree diagrams to illustrate the number of possible choices for each given scenario.
National Wildlife Federation
Ghost Town
Around 93 percent of the reefs on Australia's Great Barrier Reef have been bleached, and almost one quarter of them are now dead. Scholars research the sea temperatures, especially around the areas with coral reefs, to make connections...
