Curated OER
Go Car, Go!
Students design and build their own car. In this physics lesson, students collect data to determine the speed of the car. They plot the data on the graph analyze the relationship between variables.
Curated OER
Nasonia Genetics-A Jewel of a Wasp
Students investigate the inheritance pattern of eye color in Nasonia wasps. In this genetics and inheritance lesson plan, students read about the life cycle of Nasonia wasps and hypothesize about the possibilities of eye color inherited...
Curated OER
Statistically Lyrical
Students examine and discuss the writing of ratios as fractions and where they can be found in the real world. They complete worksheets and a questionnaire, and calculate the mean, median, and mode scores for the class.
Center Science Education
Feeling the Heat
What is an urban heat island? Middle school meteorologists find out by comparing temperatures at different locations on campus. They relate their findings to what might be happening in a concrete jungle and how it impacts local weather....
Curated OER
Genetics
Trace simple genetic patterns of inheritance through a small population. Your students create a family pedigree that traces a genetic condition through several generations.
Curated OER
China: Land Beyond the Wall
An excellent series of five lessons on China awaits you and your young geographers. In these lessons, learners engage in hands-on activities, watch streamed video, access websites, and complete activities in cooperative groups in order...
Center Science Education
Hurricanes and Climate
Feeling under the weather? This lesson on hurricanes can whip things up! With professionally designed maps and handouts, teach your future weathermen (or women) where, when, and how hurricanes occur. They identify hurricane regions and...
Curated OER
EcoTravel Log
Students keep travel record over time, analyze data collected and use the information to identify ways in which they can change their behavior to benefit their health and the environment.
Curated OER
Agriculture, Weather, Economy and Indiana
Fourth graders, in groups, investigate the role of weather in Indiana's farming economy. They make a prediction as to weather and its effect on the economy of Indiana. They present their data using a media presentation of data...
EngageNY
Scatter Plots
Scholars learn to create scatter plots and investigate any relationships that exists between the variables with a lesson that also show them that statistical relationships do not necessarily indicate a cause-and-effect...
Curated OER
Weather Watchers
Second graders discuss what weather is and list words that can be used to describe weather. In this science lesson, 2nd graders develop symbols for each type of weather and record the weather for two weeks at the same time and the same...
Curated OER
Pulse Rates
Students answer the question, "How will the intensity of exercise effect your heart rate?", using physical workouts and AppleWorks, or similar spreadsheet program. This instructional activity can conclude with the creation of a graph of...
Curated OER
Pendulum Patterns
Students identify the variables involved in the motion of a pendulum. In groups, they research how each different variable is related to the energy the pendulum produces. They share their results with the class and compare them with...
Curated OER
Box Plots
Learners review the concept of median, explore how to calculate quartiles for any size data set and experience how to build a box plot.
Curated OER
Linear Functions-Learn Your Lines
Students solve and graph linear equations. In this algebra lesson, students collect and plot data on a coordinate plane. They use the CBL and TI calculator to graph systems of equation.
Curated OER
Earthquake Patterns
Students identify and interpret the cyclical nature of the Parkfield, California earthquakes. They then investigate and graph earthquake occurrences on the Mojave segment of the San Andreas fault and then on the Hayward fault in order to...
Curated OER
Move It
Studens collect and graph data. In this algebra instructional activity, students use a CBL and CBR with a TI Calcualtor to observe linear graphs. They use the correct vocabualry as they discuss the collected data.
Curated OER
Tiling a Patio
Fifth graders practice, with spreadsheets, to demonstrate how to determine the number of tiles needed to create a patio. They use pictures and gathered data to determine a pattern that can be used to solve problems. Students create a...
Curated OER
Comparing the Food Choices and Body Image of 15-Year-Olds Around the World
Students interpret data regarding food choices and the perceived body image of youth in the world. For this personal health lesson, students compare food consumption patterns in Canada with other countries. Students also compare...
Curated OER
Weather Conditions During the Fall Monarch Migration
Students keep detailed weather records during the fall migration of the monarch butterfly. They compare weather conditions to the days they do and do not see monarchs. As a class, they graph and analyze data and send it to a university...
Curated OER
Changes in Pulse Rate
Eighth graders practice making observations and collecting data after determining a baseline pulse rate then collect data on the changes in that rate with exercise. Students must organize their data and analyze their observations.
Curated OER
The Ups and Downs of Weight and Mass
Students explore the concept of mass, and how it differs from weight. They also calculate their weight change as they ride up and down on an elevator. They record the changes in their weight as the elevator moves
graph the collected data.
Curated OER
Rate of Solution
Eighth graders determine the amount of agitation necessary to dissolve various sized sugar particles. This task assess students' abilities to collect, organize, and interpret data, create appropriate graphs, predict future events based...
Curated OER
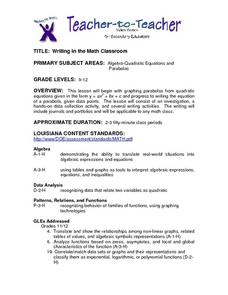
Writing in the Math Classroom
Students determine the vertex, y-intercept and direction of a parabola and write an explanation of how to graph a parabola. They collect and graph data using a calculator.

