Curated OER
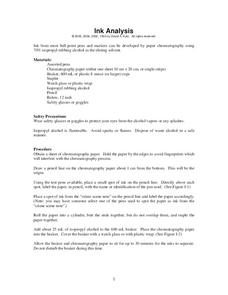
Ink Analysis
High school chemistry class members become "detectives for a day" and use the concept of paper chromatography to analyze a note left at the scene of a crime. Pupils test the ink on the note with a solvent, such as isopropyl alcohol, to...
Mathed Up!
Nets, Plans, and Elevations
A dimensional resource teaches viewers to recognize 2-D views of 3-D objects and how to match nets with their 3-D figures. Individuals draw different views of three-dimensional objects including views from the front, side elevations and...
Mathed Up!
Scatter Graphs
Make an estimate by getting in line. The class works with scatter plots and lines of best fit to make an estimate for given values. Pupils determine whether there is a positive or negative correlation and draw a best-fit line. Using the...
Mathed Up!
2D and 3D Shapes
What a great assessment to give young mathematicians in order to test their knowledge on two- and three-dimensional shapes. Learners name various shapes, identify the number of edges, faces, and vertices, match an unfolded version of a...
Mathed Up!
Probability
How likely is it to draw a blue marble? Pupils find the likelihood of events and connect that to the probability of the event. They find the probabilities of simple events and show their probabilities on a scale.
Mathed Up!
Symmetry
Eleven problems provide pupils the opportunity to find the lines of symmetry or identify rotational symmetry. Scholars alter designs to make them symmetrical, learn to recognize signs that are symmetrical, and identify the type of...
Curated OER
Tree Diagrams
For this tree diagram worksheet, students read story problems. From the given information, they draw tree diagrams to determine the total possible number of outcomes. This one-page worksheet contains ten problems.
Mathed Up!
Reflections
Tracing paper is not just for art anymore — pupils can use it to find reflected images, too! Two videos show how to reflect images using tracing paper and find the reflection between the pre-image and image. Learners perform reflections...
Mathed Up!
Congruent Shapes
Are congruent shapes compatible? Congruent shapes are identical to one another, and throughout the assessment, young mathematicians identify given shapes as congruent.
Mathed Up!
Pie Charts
Representing data is as easy as pie. Class members construct pie charts given a frequency table. Individuals then determine the size of the angles needed for each sector and interpret the size of sectors within the context of frequency....
Mathed Up!
Stem and Leaf Diagrams
Order the data within a stem-and-leaf display. Pupils take data and create and ordered stem-and-leaf diagrams, including the key. Participants take their data and determine answers about the information. Class members then find measures...
Mathed Up!
Ordering Fractions, Decimals, and Percentages
Give scholars the opportunity to show what they know about ordering fractions, decimals, and percents with a five-page, eight-problem independent practice. With clear instructions and supportive advice, learners are bound for a...
Mathed Up!
Inequalities Regions
Discover how to solve systems of inequalities by graphing. An informative video shows pupils how to determine the solution set after graphing each inequality of a system. To finish, a worksheet gives them a chance to practice this skill.
Mathed Up!
Area and Circumference of Circles
Don't go around and around, help your class determine amounts around and in a circle with a video that connects circumference to the perimeter or the distance around an object. The resource includes 14 questions dealing with circles and...
Mathed Up!
Cumulative Frequency and Box Plots
Learn how to display data. Young data analysts watch a video to review how to create cumulative frequency histograms and box plots. They work on a set of questions to practice producing these data displays.
Mathed Up!
Histograms
Class members explore how to read and use histograms by watching a video on creating and analyzing histograms. To finish, the class works on a set of questions that tests these skills.
Curated OER
Resistors
In this resistors worksheet, high schoolers answer 11 questions about resistors, their functions, symbols used to represent them, and they calculate resistance values.
Curated OER
Classification of Organisms
In this classification learning exercise, students solve 3 classification riddles, complete 6 true and false questions, complete 4 sequences, and solve a riddle about the classification of an animal.


