National Research Center for Career and Technical Education
Finance: Depreciation (Double Declining)
Of particular interest to a group of business and finance pupils, this lesson explores depreciation of automobile values by comparing the double declining balance to the straight line method. Mostly this is done through a slide...
Curated OER
Smaller Than One
Sixth graders practice converting a fraction into a decimal and a percent. They explain relationships among rational numbers. They order and compare whole numbers, fractions (including mixed numbers), and decimals using a variety of...
National Council of Teachers of Mathematics
National Debt and Wars
Take a functional approach to the national debt. Learners collect information about the national debt by decade and plot the data. They determine whether an exponential curve is a good fit for the data by comparing the percent changes...
Curated OER
Did Voters Turn Out -- or Are They Turned Off?
What was the voter turnout at your last state election? Examine voter turnout statistics from the most recent election to learn which ten states have the best turnout record. This lesson offers election data, handouts, and worksheets.
National Research Center for Career and Technical Education
Business Management and Administration: Compound Interest - A Millionaire's Best Friend
Many math concepts are covered through this resource: percentages, decimals, ratios, exponential functions, graphing, rounding, order of operations, estimation, and solving equations. Colorful worksheets and a link to a Google search for...
Curated OER
Twenty-Five Great Ideas for Teaching Current Events
Teaching current events can be an amazingly-rewarding part of your teaching week. This resource presents twenty-five ways to incorporate current events into your curriculum. It offers some outstanding ideas, such as providing your...
Newspaper Association of America
Power Pack: Lessons in Civics, Math, and Fine Arts
Newspaper in Education (NIE) Week honors the contributions of the newspaper and is celebrated in the resource within a civics, mathematics, and fine arts setting. The resource represents every grade from 3rd to 12th with questions...
Curated OER
Exquisite Excursions
Young scholars locate 6 cities, one on each of the 6 major continents. They find distance for each leg of their journey, convert to percents, use a time zone map, and convert to foreign currencies.
Yummy Math
Valentine’s Day = Roses
Roses are red, but did you know that some are lighter while others are darker? Scholars read an infographic to decipher the fraction and percent of rose color and their country of origin. They go on to make comparisons and estimate while...
NEST Family Learning
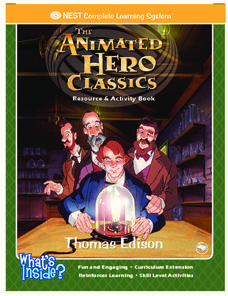
Thomas Edison: Resource and Activity Book
What other inventions was Thomas Edison responsible for besides the telegraph and lightbulb? Incorporate a set of worksheets into your study of Edison and other inventors. The 48-page packet includes all types of activities from word...
Curated OER
Finding Percent When Given A Fraction
Seventh graders calculate percentages when given a fraction. They convert a percentage to a fraction. All of this be done by each student's ability to read the graphs made available by the spreadsheet information.
Global Oneness Project
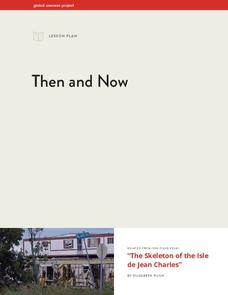
Then and Now
The devastating changes happening to the Native American inhabitants of an island off the coast of Louisiana are the topic of an informational lesson. After scholars break into groups to explore particular topics, they come back together...
US Institute of Peace
Nonverbal Communication
What is your body saying that maybe your words aren't? Scholars explore the vast world of the subtle, and not-so-subtle, nonverbal communication cues through group and individual work. Lesson seven in a series of peacebuilding exercises...
Curated OER
The Stock Market
Pupils explore the loss and gain made in the stock market as they invest a sum of money and report the results as percentages instead of points.
Curated OER
Number of Cell phones in Use Per Household
In this cell phones worksheet, students study a bar graph of the number of cell phones usage in households. Students answer 5 questions about the graph.
Yummy Math
US Holiday Candy Sales
Candy is a big business! Calculate the amount of money consumers spent on major holidays—Easter, Halloween, Christmas, Hanukkah, and Valentine's Day—based on the total amount of candy sales from 2011 and the percentage of each holiday's...
Council for Economic Education
Calculating Simple Interest
How much is owed? A calculated resource introduces the simple interest formula with a video that describes how to use it. Classmates then show what they know by answering questions within a simple interest worksheet.
American Documentary
The Benefits and Drawbacks of Plea Bargains
The outcome of 90 percent of criminal cases in the US is determined by plea bargains. Clips from the documentary Better This World create the backdrop for an investigation of the benefits and drawbacks of the plea bargaining process....
Curated OER
A World of Information
Students analyze data and statistics about countries around the world. They read graphs and charts, color a world map to illustrate the top ten statistics about the world, and write a paragraph to summarize their information.
Foreign Policy Research Institute
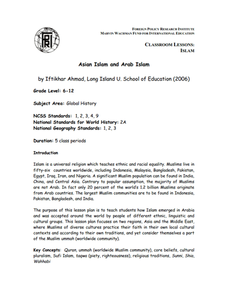
Asian Islam and Arab Islam
Focus on the impact and practice of Islam throughout Asia and the Middle East. Learners review the seven major religions, the spread of Islam, and Islamic tenets commonly practiced. They then research one country that practices Islamic...
Curated OER
Thinking About Technology: What Is It? How Can It Help Us?
What is technology and how can it help us? Using a worksheet, students read a list and choose practical applications of scientific knowledge, brainstorm examples of home, school and hospital technology, graph answers in a pie chart, and...
Curated OER
One Survivor Remembers: Anti-Semitism
Students analyze and discuss how propaganda influenced anti-Semitism and it's role in World War II. In this propaganda lesson, students define the terms involved in this assignment. Then they will discuss their reactions to a film and...
Curated OER
Aboriginal Statistics
Fourth graders analyze statistics of Native Americans by creating graphs. In this data analysis lesson plan, 4th graders define different statistical terms and practice finding those statistics from groups of numerical information...
Global Oneness Project
Deconstructing Consumerism
To increase awareness and launch a discussion of consumerism, class members view What Would It Look Like, a 25 minute film of images that capture the global effects of the consumption of goods. Viewers make a list of the images that...
Other popular searches
- Finding Percent of a Number
- Calculate Percent of a Number
- Finding Percent Part Whole
- Percent of Whole Numbers
- Percent of a Whole Number
- Find the Percent of a Number
- Finding Percent of Number
- Percent of Numbers
- Finding a Percent of a Number
- Percent Number Puzzles
- Percent of a Whole
- Percent Number Line

