Concord Consortium
Center of Population
Let the resource take center stage in a lesson on population density. Scholars use provided historical data on the center of the US population to see how it shifted over time. They plot the data on a spreadsheet to look the speed of its...
Curated OER
Just Me and My Shadow
Students take measurements throughout the day using a simple sundial called a gnomon. They record the results on a Data Log and convert from English units to metric (S.I.) units. Data points are plotted on the same graph and analyzed.
Curated OER
Crane, London, and Literary Naturalism
High schoolers analyze "To Build a Fire" by Jack London and "The Open boat" by Stephen Crane. They write an essay in which they compare and contrast the narrators and plots in each story.
It's About Time
Volcanic Hazards: Airborne Debris
Pupils interpret maps and graph data related to volcanic ash. Then they analyze the importance of wind speed and the dangers of the ash to both life, air temperature, and technology.
Curated OER
A Second Visit To Old Sturbridge Village-The Story Tour
Learners conduct research on 1830s families and early New England culture. They conduct research on the Old Sturbridge Village website, participate in an online chat with a costumed interpreter, and continue to develop possible plots to...
Hawaiʻi State Department of Education
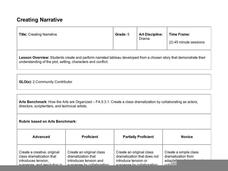
Creating Narrative
Plot, setting, characters, and conflict are common to both drama and narrative stories. Kids create narrated tableaus that show their understanding of the plot, setting, and conflict of a story they've recently read. The lesson...
Curated OER
Volcanoes: Sixth Grade Lesson Plans and Activities
Bring a set of pre-lab, lab, and post-lab lesson plans on volcanoes to your earth science unit. Sixth graders explore the three types of volcanoes found on Earth, plot the specific locations of these volcanoes on a map, and investigate...
Curated OER
Finding Ocean Depth
How to oceanographers measure the sea's depth? Your scientists will step into their shoes in this application worksheet, first reading about how the speed of sound and a simple formula give scientists a depth estimation. Students...
Curated OER
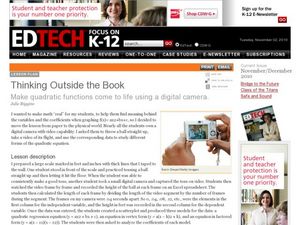
Thinking Outside the Box
Now this lesson sounds fun! Students throw a ball, film it as it soars through the air, and use a spreadsheet to collect data. A scatterplot is created to produce a quadratic regression equation, an equation in vertex form, and an...
Curated OER
How Does Water Cool?
How fast does water cool? First fifth graders will draw a line on a graph that predicts how fast they think water can cool from boiling. Then they plot the actual data on the same graph to see if their estimate was correct.
Howard Hughes Medical Institute
Patterns in the Distribution of Lactase Persistence
We all drink milk as babies, so why can't we all drink it as adults? Examine the trend in lactase production on the world-wide scale as science scholars analyze and interpret data. Groups create pie charts from the data, place them on a...
Curated OER
A Closer look at Oil and Energy Consumption
Upper graders analyze basic concepts about the consumption, importation and exportation of the worlds oil production. They create several graphs to organize the data and draw conclusions about the overall use of oil in the world.
Statistics Education Web
Double Stuffed?
True or false — Double Stuf Oreos always contain twice as much cream as regular Oreos. Scholars first measure the masses of the filling in regular Oreos and Double Stuf Oreos to generate a class set of data. They use hypothesis testing...
Curated OER
Line of Best Fit
In this line of best fit worksheet, students solve and complete 8 different problems that include plotting and creating their own lines of best fit on a graph. First, they study the samples at the top and plot the ordered pairs given on...
NOAA
Tracking a Drifter
Be shore to use this drifter resource. The third installment of a five-part series has learners using the NOAA's Adopt-a-Drifter website to track to movement of a drifter (buoy) in the ocean. Graphing the collected data on a map allows...
Bowland
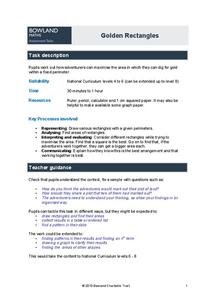
Golden Rectangles
Scholars must determine the maximum area for a rectangular plot of land enclosed with 100 meters of rope. As the work they discover patterns and numerical approaches to solve the problem.
Teach Engineering
Accelerometer: Centripetal Acceleration
Scholars build robotic arms that swing back and forth and use them to collect velocity and acceleration data. To analyze the results, pupils compare data to the equations for angular velocity and centripetal acceleration.
Nuffield Foundation
Intrepreting Information about Sweating and Temperature
Why do we sweat? Scholars analyze data about body temperature, sweating, and other factors to better understand sweating. They note the changes after drinking ice water to sweating, skin temperature, and body temperature. Analysis...
National Council of Teachers of Mathematics
National Debt and Wars
Take a functional approach to the national debt. Learners collect information about the national debt by decade and plot the data. They determine whether an exponential curve is a good fit for the data by comparing the percent changes...
Curated OER
How Are Stars Like People?
A beautifully written lesson plan delves into a beautiful topic: stellar population. Engage aspiring astronomers with activities that examine human populations and then transition onto the stars of the universe. Data and photographs for...
Curated OER
Barbie Bungee
Middle and high schoolers collect and analyze their data. In this statistics lesson, pupils analyze graphs for linear regression as they discuss the relationship of the function to the number of rubber bands and the distance of the...
Curated OER
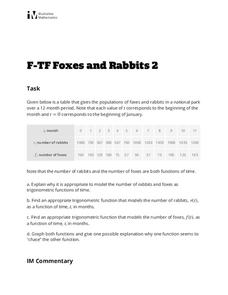
Foxes and Rabbits 2
Explore the relationship between the population of foxes and rabbits in a national park using trigonometric models. Plot data and find the appropriate trigonometric functions. Two questions require interpretation and explanation of...
Curated OER
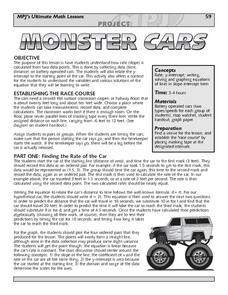
Monster Cars: Slope
Students examine how a rate is calculated from two points. Using battery operated cars, pairs of students measure time and distance. Afterward, they use this data to calculate the rate. Students then plot four ordered pairs and discover...
Curated OER
Single Event Upsets in Aircraft Avionics
In this aircraft avionics worksheet, science fans read about the first unmanned air vehicle that collects data about the Earth and is subject to damage by cosmic ray showers. Pupils analyze two graphs of data showing the neutron flux vs....


