Curated OER
Getting A Grip On Graphs
Fourth graders investigate the concept of graphing and comparing different types of data using pictographs, line graphs, scatter plots, etc... They gather data and make interpretations while examining the medium of how it is displayed.
Curated OER
The Doctrine of Signatures
Students use the graphing calculator and the core equation: y=Ax^2+Bx+C where A = the acceleration of gravity/2, B = the initial velocity, and C = initial height above ground to graph parabolas for Earth and Mars. They experiment with...
Curated OER
Unit 13: Graphs, Correlation, Line of Best Fit
Students explore the concepts of graphs, correlations, line of best fit, and the dipstick problem. In this graph, correlation, line of best fit and dipstick problem lesson, students solve problems on the above mentioned topics. ...
Curated OER
Completing University
Students analyze the pros and cons of completing a 4 year school. In this statistics lesson, students complete surveys and use E-STAT to graph their data. They learn to plot and build diagrams.
Virginia Department of Education
Middle School Mathematics Vocabulary Word Wall Cards
Having a good working knowledge of math vocabulary is so important for learners as they progress through different levels of mathematical learning. Here is 125 pages worth of wonderfully constructed vocabulary and concept review cards....
EngageNY
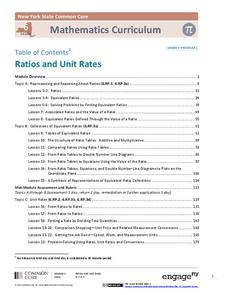
Ratios and Unit Rates
This turn-key unit on ratios and unit rates walks through a 30-lesson unit on teaching proportional reasoning, with each lesson broken into detailed teaching notes and time allotments for all parts. An unbelievable resource when taken...
Curated OER
Maximize area
For this subscription-based activity, algebra learners model changes in the length and width of a rectangle to determine the maximum area possible for a given perimeter and solve several application problems involving area, included in...
Curated OER
Which is Closer to 1?
A seemingly simple question that reveals a lot about a student's understanding of fractions. In finding an answer, learners compare fractions with different denominators that are both greater and less than one. No number line is...
Illustrative Mathematics
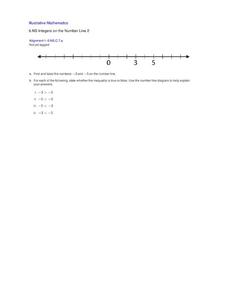
Integers on the Number Line 2
Four inequality statements are given for the same two negative numbers. The resource is a good practice for pupils to interpret statements of inequalities relative to the position on the number line. The objective is for pupils to learn...
Curated OER
Jon and Charlie's Run
Let's use math to solve an argument. Jon and Charlie are debating about who can run farther, but who is right? That's what your class will figure out as they apply their understanding of fractions to this real-life situation. A simple,...
Curated OER
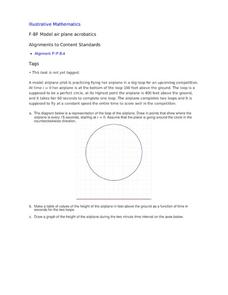
Model Air Plane Acrobatics
Your young airplane enthusiasts will enjoy this collaborative task of graphing an airplane's distance from the ground as it flies in a perfect circle. They will discover that they have graphed a sinusoidal function that comes from the...
Math Sphere
Co-Ordinates
Challenge young mathematicians' understanding of the coordinate plane with this series of skills practice worksheets. Offering 10 different exercises that involve identifying ordered pairs, graphing polygons, and rotating/reflecting...
Houghton Mifflin Harcourt
Unit 3 Math Vocabulary Cards (Grade 3)
Looking for math vocabulary cards for third graders? Use a set of 15 math cards with terms associated with graphing. The top half of each sheet has the vocabulary word printed in bold text, and the bottom half includes the word's...
Curated OER
Raisin the Statistical Roof
Use a box of raisins to help introduce the concept of data analysis. Learners collect, analyze and display their data using a variety of methods. The included worksheet takes them through a step-by-step analysis process and graphing.
Noyce Foundation
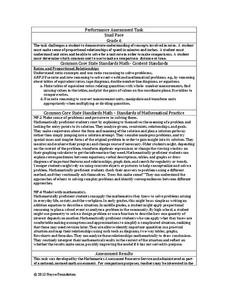
Snail Pace
Slow and steady wins the race? In the assessment task, scholars calculate the rates at which different snails travel in order to find the fastest snail. Hopefully, your class will move much more quickly in finishing the task!
Curated OER
Make a Frequency Table and a Histogram for a Given Set of Data
In this data recording and data organization worksheet, students create one frequency table and one histogram for a given list of data. Explanations and examples for frequency tables and histograms are given.
Helping with Math
Ratio and Proportion: Simplifying Ratios (2 of 2)
In this assignment, math stars simplify ratios. The first half just displays numbers, whereas the second half describes real-world scenarios with ratios to be written and reduced. The publisher mentions CCSS.Math.Content.6.RP.3, but it...
Curated OER
WHAT IS THE POPULAR COLOR?
Fourth graders graph cars according to their colors. They complete the graph including a title, scale, x-axis, and y-axis. Students collect the data and choose the type of graph to be made.
Curated OER
Shadows and Skyscrapers
Eighth graders explain the relationship between the position of the sun, a city's latitude and shadow length. Ratio's, geometry, and algebra are used to determine the shadow lengths and building heights. A sun angle (altitude) charts to...
Curated OER
Exploration 1: Instantaneous Rate of Change Function
In this function worksheet, students read word problems and write functions. They determine the instantaneous rate of change and identify intervals. This three-page worksheet contains approximately 20 problems.
National Security Agency
Line Graphs: Gone Graphing
Practice graphing and interpreting data on line graphs with 36 pages of math activities. With rationale, worksheets, and assessment suggestions, the resource is a great addition to any graphing unit.
Curated OER
Quartiles, Percentiles, and Cumulative Frequency
In this statistics lesson, 11th graders are asked to calculate the percentiles, quartiles and cumulative frequency given different graphs and data. There are 6 questions with an answer key.
Curated OER
Naming Points on the Coordinate Plane
For this naming points on the coordinate plane worksheet, middle schoolers name 6 coordinates off of 6 graphs. Students name the x and y-coordinates of 6 different points in all four quadrants.
Curated OER
Graphing Linear Equations
Ninth graders review the information that they have already learned
with regard to linear equations and graphical representations. They then assist in combining equations with a graphical element and complete various graphs with this...
Other popular searches
- Short Story Plot Diagram
- Creation Myth Plot Diagram
- Plot Diagram the Outsiders
- Blank Story Plot Diagram
- Julius Caesar Plot Diagram
- Plot Diagram for Fiction
- Free Story Plot Diagram
- Creating Plot Diagram
- Story Plot Diagram Steps
- Folktale Story Plot Diagram
- Plot Diagram for Stories
- Story Plot Diagram Samples


