Curated OER
Graph Picture (Coordinate Pairs)
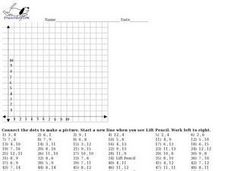
Coordinate graphing on a grid is the focus of this worksheet. Young mathematicians plot 42 coordinate pairs on a graphing grid, then connect the dots to make a picture. A fun way to get your learners involved in graphing!
Curated OER
Graph Picture (Coordinate Pairs) 2
Looking for an engaging way to encourage your class to practice graphing coordinate pairs? This might be the activity you are looking for! For this worksheet, learners create a picture by plotting 54 coordinate pairs on graph and then...
Curated OER
Graph Picture (Coordinate Pairs) 3
Here is a very good coordinate graphing worksheet. Learners practice graphing by plotting 58 coordinate pairs, then connecting the dots to reveal a picture. This resource could be used as an in-class activity or a homework assignment.
Curated OER
Halloween Point Plot
Practice graphing and plotting points with a festive Halloween flair! Scholars plot 21 points on a grid, connecting them to create a spooky shape!
Shodor Education Foundation
Scatter Plot
What is the relationship between two variables? Groups work together to gather data on arm spans and height. Using the interactive, learners plot the bivariate data, labeling the axes and the graph. The resource allows scholars to create...
Shodor Education Foundation
Ordered Simple Plot
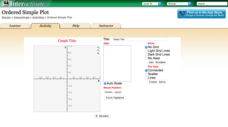
Open your imagination to make algebra-inspired creations. An interactive lesson has scholars graph images from a set of parameters. Users can practice minimum values, maximum values, and scale as well as key features.
Curated OER
Graphing Linear Equations
In this graphing linear equations worksheet, students plot 22 lines on their coordinate grids. When directions are followed carefully, the result is a picture.
Charleston School District
Analyzing Scatter Plots
Scatter plots tell a story about the data — you just need to be able to read it! Building from the previous lesson in the series where learners created scatter plots, they now learn how to find associations in those scatter plots. They...
Charleston School District
Graphing Functions
How do letters and numbers create a picture? Scholars learn to create input/output tables to graph functions. They graph both linear and nonlinear functions by creating tables and plotting points.
Shodor Education Foundation
Box Plot
What information can come from a box? Learners choose a data set to display as a box plot and decide whether to include the median in the calculation of the quartiles, show the outliers, and change the scale. To finish the lesson,...
Virginia Department of Education
Graphing Linear Equations
Combine linear equations and a little creativity to produce a work of art. Math scholars create a design as they graph a list of linear equations. Their project results in a stained glass window pattern that they color.
Curated OER
Graph a Picture on Cartesian Coordinates
Find out what picture is hidden in this graph and work on coordinate graphing with this worksheet! Learners plot 66 ordered pair points on a Cartesian graph, then connect the dots to make a picture. This would work as an in-class...
Curated OER
Let's Plot Points
Use coordinate grid paper to plot points and identify shapes that are already plotted on the paper by saying their coordinates. Pupils also measure the distance between points and play the game Battleship. There are several web links and...
Alabama Learning Exchange
I Know What You Did Last Summer: A Data Graphing Project
Young scholars participate in graphing data. In this graphing data instructional activity, students make a stem and leaf plot of their summer activities. Young scholars create numerous graphs on poster boards. Students discuss the...
Curated OER
Drive the Data Derby
Three days of race car design and driving through the classroom while guessing probability could be a third graders dream. Learn to record car speed, distances traveled, and statistics by using calculation ranges using the mean, median,...
Shodor Education Foundation
Graphit
No graphing calculator? No worries, there's an app for that! Young mathematicians use an app to graph functions. In addition, they can also plot data points.
Balanced Assessment
Cost of Living
Math scholars investigate the cost of living in Hong Kong compared to Chicago but must first convert the different types of currency. They then choose a type of graph to compare different spending categories and finish the activity by...
Shodor Education Foundation
Multi-Function Data Flyer
Explore different types of functions using an interactive lesson. Learners enter functions and view the accompanying graphs. They can choose to show key features or adjust the scale of the graph.
Curated OER
Spaghetti Graphs
Students work in pairs to test the strength of spaghetti strands. They collect and graph data to determine a line of best fit. Students create a linear equation to interpret their data. Based on the data collected, students predict...
Curated OER
You Can Get There From Here - Plotting on a Coordinate Plane
In this plotting worksheet, students plot given ordered pairs on a coordinate plane. After plotting each ordered pair, students connect line segments in consecutive order. Upon completion of the graphing exercise, students will have...
Curated OER
What's Brewing? Graphing On A Coordinate Plane
In this graphing worksheet, students graph given ordered pairs on a coordinate plane and connect the dots in consecutive order. Upon completion of the graphing exercise, students will have created a picture on the coordinate plane. They...
Math Worksheets Land
Halloween Cartesian Art: Bat
Get the class batty over graphing. Young mathematicians plot ordered pairs in all quadrants of a Cartesian plane, and connect the points to create a bat.
Math Drills
Halloween Cartesian Art: Witch Hat
What is the mystery picture? After plotting points on the first quadrant of a Cartesian coordinate system, young mathematicians connect the points to create a Halloween-themed picture.
Curated OER
Explore Chapters 1 - 5
Students preview the novel, "Dragonwings," by Laurence Yep, make connections between the novel previewed and their prior knowledge, other texts, and the world. They utilize graphic representations including charts, graphs, pictures, and...


