EngageNY
An Appearance of Complex Numbers 2
Help the class visualize operations with complex numbers with a instructional activity that formally introduces complex numbers and reviews the visualization of complex numbers on the complex plane. The fifth installment of a 32-part...
Sri Atmananda Memorial School
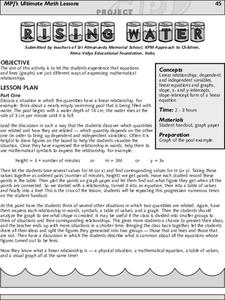
Rising Water
An engaging, and not to mention attractive, lesson plan has prealgebra and beginning algebra scholars examining linear relationships. They consider the rising water level as a swimming pool is being filled. They do so by charting and...
EngageNY
Arithmetic and Geometric Sequences
Arithmetic and geometric sequences are linear and geometric patterns. Help pupils understand the relationship and see the connection with an activity that asks them to write the rules and classify the patterns correctly. A sorting...
Willow Tree
Approximating a Line of Best Fit
You may be able to see patterns visually, but mathematics quantifies them. Here learners find correlation in scatterplots and write equations to represent that relationship. They fit a line to the data, find two points on the line, and...
Curated OER
Quadrilaterals in the Coordinate Plane
Students find the coordinates of the vertices of special quadrilaterals placed in the coordinate plane. They find the coordinates of missing vertices of squares and parallelograms.
Houghton Mifflin Harcourt
Unit 3 Math Vocabulary Cards (Grade 3)
Looking for math vocabulary cards for third graders? Use a set of 15 math cards with terms associated with graphing. The top half of each sheet has the vocabulary word printed in bold text, and the bottom half includes the word's...
Curated OER
Rectangles and Trapezoids in the Coordinate Plane
Learners determine the missing vertices of quadrilaterals. In this rectangles and trapezoids lesson, students examine the characteristics of quadrilaterals. They identify the missing vertices of a quadrilateral on a coordinate plane.
Virginia Department of Education
Graphing Linear Equations
Combine linear equations and a little creativity to produce a work of art. Math scholars create a design as they graph a list of linear equations. Their project results in a stained glass window pattern that they color.
Curated OER
Review Graphing Parabolas & Circles
Young scholars review how to graph parabolas. They practice graphing two different parabolas using the vertex and table method. They solve problems related to graphing circles, determining the radius and the center.
EngageNY
Modeling Linear Relationships
Math modeling is made easy with the first installment of a 16-part module that teaches pupils to model real-world situations as linear relationships. They create graphs, tables of values, and equations given verbal descriptions.
Curated OER
Connect the Mathematical Dots
Teachers can choose visual activities that demonstrate the elegance associated with the coordinate plane.
EngageNY
Graphs of Simple Nonlinear Functions
Time to move on to nonlinear functions. Scholars create input/output tables and use these to graph simple nonlinear functions. They calculate rates of change to distinguish between linear and nonlinear functions.
Virginia Department of Education
How Much is that Tune?
Tune in for savings! Scholars investigate pricing schemes for two different online music download sites. After comparing the two, they determine the numbers of songs for which each site would be cheaper.
Virginia Department of Education
Line of Best Fit
Pupils work through a guided activity on fitting a linear equation to a set of data by entering the data into a calculator and trying to envision a line of best fit. They then have the calculator determine the least-squares line and...
Curated OER
Rate of Change
Students observe and calculate slopes. In this algebra lesson plan, students graph equations and determine the pace at which the slope is changing. They use the navigator to see the change as they graph the lines around.
Thomson Brooks-Core
Complex Numbers
A straightforward approach to teaching complex numbers, this lesson addresses the concepts of complex numbers, polar coordinates, Euler's formula, De moivres Theorem, and more. It includes a practice problems set with odd answers and a...
Pennsylvania Department of Education
The Multiplicative Identity and Numbers Close to One
Pupils practice multiplying and dividing whole numbers by fractions. They study the multiplicative identity property that states that the product of any number and 1 is that number. They multiply whole numbers by fractions close to 1 and...
Curated OER
Bungee Jump Lab
Student apply linear relationships to the real world. They use Ken and Barbie dolls and experiment to find the line of best fit. They collect data, analyze data, and make predictions from it. The students also use Microsoft Power Point...
Curated OER
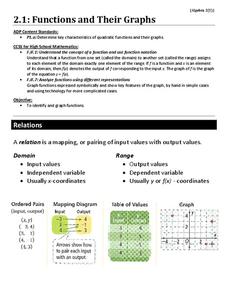
Functions and Their Graphs
Use a worksheet to go over the basic concepts of relations and functions. Included are clear definitions and examples of relations, domain and range, and functions and the vertical line test. However, the problems are pretty basic. A...
Curated OER
Three Methods for Using Quadratic Functions to Model Data
In this modeling data learning exercise, students use quadratic functions to model data using three different methods. This learning exercise provides explanations and an example. Additionally, students are given the steps to find the...
Curated OER
Drug Sales Soar - Rate of Change
In this prescription drug worksheet, students answer short answer questions and create graphs on the sales of prescription drugs over a five year span. Students complete six questions.
Curated OER
Walking Math into the Real World
Students measure an area given a yardstick. They also convert inches into a fractions of a foot and use data to create a linear graph.
Curated OER
Coordinate Graphs, Translations and Reflections
Students perform translations and reflections. In this algebra lesson, students use the TI calculator to graph functions. They move the functions around on the coordinate plane using translation and reflection.
Curated OER
Exploring Area/Perimeter Through Coordinate Geometry
Students explore area and perimeter through coordinate geometry using student literature, hands-on manipulatives, and the Internet.


