Curated OER
Linear Regression on TI-89
For this linear regression worksheet, students use the TI-89 calculator to graph linear regressions. Details instructions on the use of the calculator are provided. This one-page worksheet contains six problems.
Curated OER
Integers
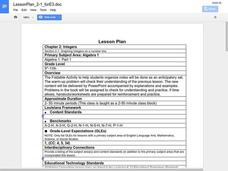
Learners graph integers on a number line. In this integers lesson, students create a colored foldable to assist them with notetaking and problem solving. Learners complete exercises from text.
Curated OER
Countdown Challenge: Coordinate Plane
In this coordinate plane worksheet, students find the coordinates on a graph and discover a word or phrase. They plot 27 ordered pairs on three coordinate planes. This is a one-page worksheet.
Curated OER
Graphs of the Sine and Cosine Function
For this college level Pre-Calculus worksheet, students investigate the graphs of the sine and cosine functions. The six page worksheet contains seventy-eight problems. Solutions are not provided.
Curated OER
More On Graphing Linear Equations
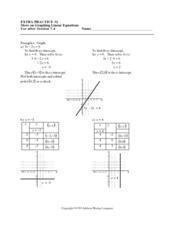
In this linear equation worksheet, students graph linear equations and identify the x or y-intercept. There are nine graphing equations on this two-page worksheet.
Curated OER
Graphs of Functions
In this graphs of functions worksheet, students use a table of information on packages of gum/total pieces per package to solve a set of 6 word problems.
Curated OER
More Graphing With Intercepts
In this graphing worksheet, pupils graph linear equations. They identify the x or y-intercept. Coordinate planes are available below each equation. Nine problems are provided on this two-page worksheet.
Curated OER
Read, Recognize & Graph Integers
Students explore negative and positive integers on a number line. They review a newspaper to determine careers that use positive and negative integers. In groups, they read and answer questions on "Lifestyles of the Rich and...
Curated OER
Batteries in Series: Voltage and Light Intensity
Students participate in a hands-on activity to explore the relationship between the number of batteries in a series circuit and its voltage. Students identify the relationship between two variables and plot points on a graph.
Curated OER
Plot the Coordinates
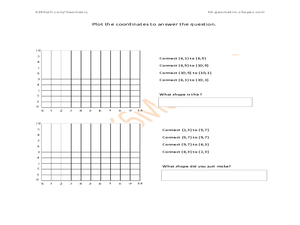
In this plotting coordinates worksheet, students plots sets of coordinates on graphs, then identify the shape the connected points have created. A reference web site is given for additional activities.
Curated OER
Graphing Linear Equations
Ninth graders review the information that they have already learned
with regard to linear equations and graphical representations. They then assist in combining equations with a graphical element and complete various graphs with this...
Curated OER
Who's got the fastest legs?
Students use a stopwatch to collect information for a scatterplot. In this fastest legs lessons, students collect data through the taking of measurements, create and find a median number. Students develop an equation and...
Curated OER
Super Bowl Champs
In this Super Bowl instructional activity, students create line plots of all winners and losers of the Super Bowl. They create stem-and-leaf plots, scatter plots, and bar graphs of football data. This one-page...
Texas Instruments
Making Predictions Using Systems of Equations
Young scholars explore the concept of systems of equations. In this system of equations lesson, students enter data into lists on their calculators about 100 meter dash times. Young scholars plot the points using a scatter plot and...
Curated OER
Ordered Pairs on a Coordinate Plane
Seventh graders identify the quadrants and axis of a coordinate plane. In this algebra instructional activity, 7th graders discover the correct way to graph using the coordinate plane. They discuss the relationship between x and y...
Curated OER
Graphing Linear Equations
In this calculator active graphing worksheet, students graph 12 equations via a calculator and transfer the graphs onto coordinate grids.
Curated OER
Flips, Turns, and Slides: Adventures with Transformations
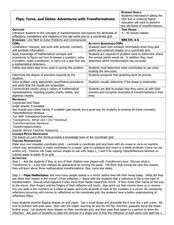
Learners explore transformations. In this math lesson, students plot points on a coordinate grid and construct shapes. Learners discuss movements on the grid as flips, turns and slides.
Curated OER
The Definition Derivative
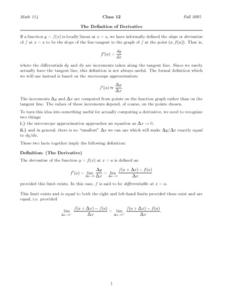
In this derivative worksheet, students evaluate limits, factor equations, and calculate the given function. They determine the derivative of a function and plot it on a graph. This four-page worksheet contains eight problems.
Inside Mathematics
Scatter Diagram
It is positive that how one performs on the first test relates to their performance on the second test. The three-question assessment has class members read and analyze a scatter plot of test scores. They must determine whether...
Mathematics Vision Project
Module 6: Congruence, Construction, and Proof
Trace the links between a variety of math concepts in this far-reaching unit. Ideas that seem very different on the outset (like the distance formula and rigid transformations) come together in very natural and logical ways. This...
Statistics Education Web
How High Can You Jump?
How high can your pupils jump? Learners design an experiment to answer this question. After collecting the data, they create box plots and scatter plots to analyze the data. To finish the lesson plan, they use the data to...
Concord Consortium
Function Project
What if a coordinate plane becomes a slope-intercept plane? What does the graph of a linear function look like? Learners explore these questions by graphing the y-intercept of a linear equation as a function of its slope. The result is a...
Concord Consortium
Center of Population
Let the resource take center stage in a lesson on population density. Scholars use provided historical data on the center of the US population to see how it shifted over time. They plot the data on a spreadsheet to look the speed of its...
Curated OER
Mathematical Modeling
Study various types of mathematical models in this math lesson. Learners calculate the slope to determine the risk in a situation described. They respond to a number of questions and analyze their statistical data. Then, they determine...

