Statistics Education Web
Using Dice to Introduce Sampling Distributions
Investigate the meaning of a sample proportion using this hands-on activity. Scholars collect data and realize that the larger the sample size the more closely the data resembles a normal distribution. They compare the sample proportion...
Statistics Education Web
It’s Elemental! Sampling from the Periodic Table
How random is random? Demonstrate the different random sampling methods using a hands-on activity. Pupils use various sampling techniques to choose a random sample of elements from the periodic table. They use the different samples to...
Cornell University
Mechanical Properties of Gummy Worms
Learners won't have to squirm when asked the facts after completing an intriguing lab investigation! Hook young scholars on science by challenging them to verify Hooke's Law using a gummy worm. Measuring the length of the worm as they...
Curated OER
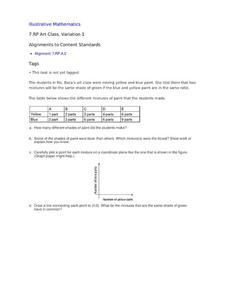
Art Class, Variation 1
Student statisticians calculate ratios to determine how many shades of green were mixed by Ms. Baca's art class. They graph the number of blue parts against the number of yellow parts for each combination and discover that some produce...
Illustrative Mathematics
Half of a Recipe
Kids love to cook! What is a better place to learn mixed numbers than with a recipe? It is up to learners to decide how they want to divide this recipe in half. They may choose to model the mixed number and then divide the model by two....
Curated OER
Basketball Bounces, Assessment Variation 1
This highly scaffolded, summative assessment tasks learners to choose the model that represents the height of a bouncing basketball given the data in graph and table form. Learners then use the model to answer questions about the...
Curated OER
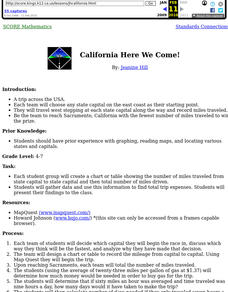
California Here We Come!
A highly relevant and great cross-curricular project! In teams, your class will plot a course from the East Coast to Sacramento, California passing through all of the state capital cities along the way. As part of the journey, teams...
Curated OER
Intro to 1D Kinematics with Physlets
Twelfth graders examine illustrations and animations on a Physlets CD in which they must describe motion, analyze graphs, and calculate initial velocity. The Physlet assists in providing active class participation in discussion.
Curated OER
Student Heights
Students measure the heights of their fellow classmates and create a box and whisker plot to display the data. In this measurement lesson plan, students analyze the data and record results.
Curated OER
Typhoon Project
Students graph and outline the path of a typhoon. In this algebra lesson, students measure the path of the typhoon and create a graph with their data. They analyze the data and make predictions.
Curated OER
Stressed to the Breaking Point
Students explore the relationship between the amount of weight that can be supported by a spaghetti bridge, the thickness of the bridge, and the length of the bridge to determine the algebraic equation that best represents that pattern...
Curated OER
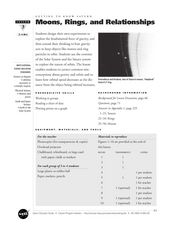
Getting to Know Saturn: Moons, Rings, and Relationships
Students identify the different objects that orbit Saturn. In this space science instructional activity, students plot the graph of orbital speed and distance. They explain why planets and asteroids remain in orbit around the sun.
Curated OER
Highs and Lows
Plot data using the number line and discuss how negative numbers are used in math and science. Sixth and seventh graders share their graph with the class and provide an explanation for their plotting.
Curated OER
Hyperbolas
Students engage in a lesson that covers the concepts related to the graphing of hyperbolas looking at topics like foci, center, vertices, and asymptotes. They find multiple different points in the coordinate plain and then plot the graph.
Curated OER
Linear Modelling of the Life Expectancy of Canadians
Middle and high schoolers explore the concept of linear modelling. In this linear modelling lesson plan, pupils find the line of best fit for life expectancy data of Canadians. They compare life expectancies of men and women, and...
Curated OER
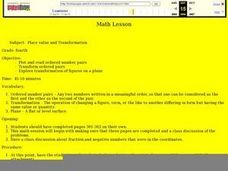
Place Value and Transformation
Fourth graders have a class discussion about fraction and negative numbers that were in the coordinates. They plot and read ordered numbered pairs. They transform ordered pairs and explore transformation of figures on a plane.
Curated OER
Off to College
High schoolers investigate linear, quadratic and exponential equations using the TI calculator. They identify relation and functions using ordered pairs, graph the data, analyze the data, and relate it to real-world situations.
Curated OER
Graphs And Ellipses
Students become acquainted with linear graphs, the parabola and the rectangular hyperbola. Also prepare tables of paired values as preparation for plotting a line. They study the cartesian equation of an ellipse, with a worked example.
Curated OER
Plotting Amish Farmland
Second graders listen to the book, Down Buttermilk Lane by Barbara Mitchell. They discover how to read a grid and then together as a class, plot 2 squares, one yellow and one green. Then they plot the remaining squares independently and...
Curated OER
Calculating & Graphing Using a Spreadsheet
Learners use the lab apparatus to calculate the average velocity and average acceleration at several points and record the data. They use the spreadsheets to plot distance vs. time, velocity vs. time and acceleration vs. time graphs.
Curated OER
Chapter 3 - Worksheet 3E - Functions
In this function worksheet, learners observe graphs and determine if the function of the graph is odd or even. They find the inverse of a function and determine the horizontal asymptote of a function. This four-page worksheet contains...
Curated OER
Scatterplots
In this scatterplots worksheet, students construct a scatter plot from a given data set. Students then answer 4 questions regarding the least-squares regression line and making predictions.
Curated OER
Coordinates (3)
In this math worksheet, students explore coordinate graphing by analyzing a graph which has points plotted on both positive and negative sides. Students locate the points indicated and write the ordered pairs. There are no instructions...
Curated OER
Temperature Comparisons
Students practice plotting temperature data points on a line graph in groups and examine the temperature differences at the same time of year. They graph the temperatures in Lannon, WI, and Mitchell's Plain, SA. After the data has been...


