Curated OER
Population and Productivity: Two P's in a Pod
Students investigate the link between countries' population growth rates and levels of industrialization. They observe that, over time, as a country becomes more industrialized, its population growth rate decreases.
Curated OER
These Maps are for the Birds
Students identify and study New York State Breeding Bird Atlas maps to learn where different bird species nest and how their distributions have changed over time. They also identify how maps serve as representations of a geographic...
Curated OER
Charts, Maps, and Graphs Lesson on the Holocaust
Students practice interpreting data. In this Holocaust lesson, students research selected Internet sources and examine charts, maps, and graphs regarding the Jewish populations in and out of Europe. Students respond to questions about...
Curated OER
Regents High School Examination: Living Environment 2003
The living environment, from the interior of a cell to the complex relationships among populations, are queried in this final examination. Learners look at air pollution maps, diagrams of cells, population graphs, and drawing of cells....
Curated OER
Understanding "The Stans"
Learners explore and locate "The Stans" in Central Asia to create, write and illustrate maps, graphs and charts to organize geographic information. They analyze the historical and physical characteristics of Central Asia via graphic...
Curated OER
How Big is Big?
Geography learners compare and contrast population densities throughout the world. Using maps, they estimate the relative size of the world's regions and populations. They develop analogies to discover the world they live in and...
Curated OER
Mapping Districts
Students use maps to learn about the U.S. Census. In this 2010 Census lesson plan, students visualize census data on maps, use map keys to read population maps, and explore the concept of population density.
Curated OER
Lesson 2: Mapping Sub-districts
Students learn more about the census. In this mapping sub-districts lesson plan, students visualize census data on a map, use a map key to read a population map, and better understand the concept of population density.
Curated OER
Mapping Districts
Learners become literate in their use of maps. In this 2010 Census lesson plan, students visualize census data on maps, use map keys to read population maps, and explore the concept of population density.
Curated OER
Carbon Monoxide and Population Density
Tenth graders investigate the carbon monoxide level at a fixed latitude. They determine if there is a relationship to population density. They download data sets and generate a graph. They determine a link between human activity and...
Curated OER
Why We Count
Students visualize census data on a map and use a map key to read a population map. In this census lesson, students use a map of the Virgin Islands and corresponding worksheets to gain an understanding of population density.
Curated OER
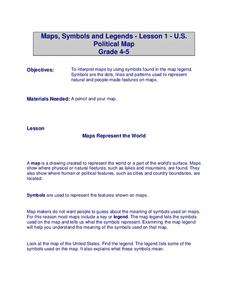
U.S. Political Map
Learners explore the symbols found in a map legend. In this map skills lesson, students locate the legend on a political map and explain what each of the symbols mean. Learners locate and identify several symbols on the map.
Curated OER
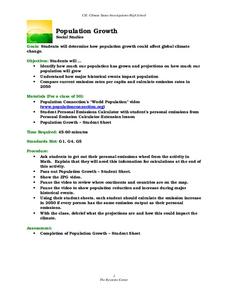
Population Growth
Students calculate human emission rate by year 2050. In this social studies lesson, students watch a video online and analyze population trends. They explain how e total emissions affect global climate.
Curated OER
Densest Population Countries Quiz
In this online interactive geography worksheet, students examine a chart with population density details and identify the 20 most densely populated countries in the world within 4 minutes.
Curated OER
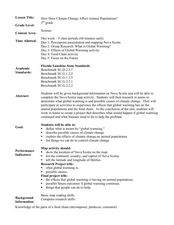
How Does Climate Change Affect Animal Populations?
Students investigate the effect of climate change on animal population in Nova Scotia. In this environmental science lesson, students complete a Nova Scotia map activity and research the causes of global warming in small groups. Students...
Curated OER
Mapping Counties
Students practice reading a map. In this mapping lesson, students illustrate a map and compare and contrast the counties based on their population. Students also explore what a census is and read census data on a map. A student...
Curated OER
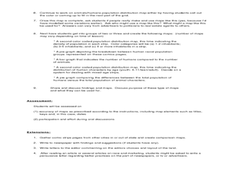
What is the Population Distribution of Cartoon Characters Living On the Pages of Your Newspaper?
Pupils read various cartoons in their local newspaper and calculate the population demographics, spatial distribution and grouping of the characters. Using this information, they create a population distribution map and share them with...
ESRI
Juneteenth: An American History through Maps
An interactive website traces the history of Juneteenth celebrations from their origin in Galveston, Texas, on June 19th to the present day. Using interactive maps, learners can find information about the African-American population...
University of Richmond
Foreign-Born Population 1850-2010
If America is a nation of immigrants, where are they from and why did they come? Demographic data and interactive maps help pupils consider answers to these questions by examining the statistics of foreign-born Americans. Features allow...
Curated OER
Mapping Population Changes In The United States
Students create a choropleth map to illustrate the population growth rate of the United States. They explore how to construct a choropleth map, and discuss the impact of population changes for the future.
Curated OER
Population Change in Vermont, 1990-2000
Students improve their mapping skills and knowledge about population distribution and change in Vermont at the county level. They are divided into groups of two or four. Each group is given two county base maps and the population...
Curated OER
A Look at the Population Density of the United States
Students acquire census information and create maps of the population density of the United States on different scales. They role play the roles of workers of a retail company and they use the population data to market to their customers.
Curated OER
Populations in the Path of Natural Hazards
High schoolers read "Geographical Mobility: 1995-2000." They examine the maps in the handouts and compare them with maps from an atlas. In the second part of this lesson plan, students read "In Harm's Way." They receive three more...
Other popular searches
- World Population Maps
- Maps Population
- Isoline Population Maps
- China Population Maps
- Ursuline Population Maps
- Maps Population Density Map
- Comparing Population Maps


