Population Education
Population Map
Here is a very interesting graphic of a world map where each country's size is adjusted accordingly to its population. The bottom row of the document also includes several maps depicting the major shifts and growth of the world...
Curated OER
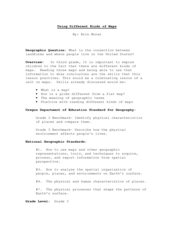
Using Different Kinds of Maps
Third graders explore the landforms and population diversity. They read maps and examine geographic terms. Students create their own map of the United States and answer questions about the location of people. After exploring the map, 3rd...
Delegation of the European Union to the United States
The Geography of Europe
What is the European Union? Where is it? Why is it? To begin a study of the EU, class members examine the physical geography of Europe and the size and population density of 28-member countries in comparison to non-member countries like...
Curated OER
Size It Up: Map Skills
Compare information from a US population cartogram and a standard US map. Learners draw conclusions about population density by analyzing census data a population distribution. They discover that census data is used to apportion seats in...
Curated OER
Social Studies: Area and Population Density
Math scholars of many ages examine the concept of population density and then discuss the significance of the population densities of Minnesota and China. They figure the population density of their school.
Curated OER
From Restriction Maps to Cladograms
Biology aces analyze restriction maps to determine the relationships among different primate species and then complete a cladogram. Preface this lesson with an explanation of how restriction enzymes are used to create the DNA maps....
Curated OER
Grid Frame Mapping
Young scholars map and describe small area of the schoolyard and discuss habitats.
Curated OER
What in Our World Affects the Way People Live
Sixth graders study various maps that show geographical features and population. They compare the maps and make inferences about how various geographical features influence the population and human activities of an area.
Curated OER
Populism and the People’s Party
Students examine the history of the Populist Party as it relates to its reforms and economic plight. In this Populism and the People's Party instructional activity, students explore why farmers experienced financial difficulty at the end...
Curated OER
Ecuadorian Rainforest
Have your class talk about the importance of the rainforest and the products that come from it. Learners watch a video showing the path of chocolate from the rainforest to the supermarket. They discuss how the rainforest and chocolate...
Curated OER
Population and Air Pollution
Students conduct Internet research to compare the impact of increasing populations and how it affects air pollution in both, the USA and Russia. Students present their finding in a creative manner by developing brochures, bumper...
Curated OER
How Big is Big?
Geography learners compare and contrast population densities throughout the world. Using maps, they estimate the relative size of the world's regions and populations. They develop analogies to discover the world they live in and...
Curated OER
US City Quality of Life Analysis and Comparison
Students analyze US census data and criteria to compare and measure the quality of life in the country's fifty largest cities. After accessing the 2005 quality of life world report online, students conduct their study to compare three...
Curated OER
Comparing Countries
Students compare facts about different countries. In this comparing instructional activity, students collect information about the US and another country and compare them. Students locate countries on the map and make a hypothesis about...
Curated OER
Mapping Districts
Students use maps to learn about the U.S. Census. In this 2010 Census lesson plan, students visualize census data on maps, use map keys to read population maps, and explore the concept of population density.
Curated OER
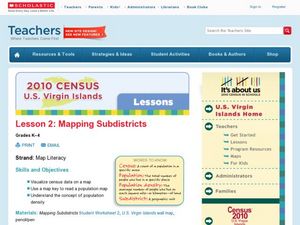
Lesson 2: Mapping Sub-districts
Students learn more about the census. In this mapping sub-districts lesson plan, students visualize census data on a map, use a map key to read a population map, and better understand the concept of population density.
EngageNY
Modeling an Invasive Species Population
Context makes everything better! Groups use real data to create models and make predictions. Classmates compare an exponential model to a linear model, then consider the real-life implications.
Curated OER
Population Growth
Students calculate human emission rate by year 2050. In this social studies lesson, students watch a video online and analyze population trends. They explain how e total emissions affect global climate.
Curated OER
Comparative Geography II
Young scholars engage in a research question of finding the effect of population density upon the use of land in a physical area. They also find the effect of how this can effect the lifestyles of the people who live there.
Curated OER
What is the Population Distribution of Cartoon Characters Living On the Pages of Your Newspaper?
Pupils read various cartoons in their local newspaper and calculate the population demographics, spatial distribution and grouping of the characters. Using this information, they create a population distribution map and share them with...
Curated OER
Mapping Counties
Students practice reading a map. In this mapping lesson, students illustrate a map and compare and contrast the counties based on their population. Students also explore what a census is and read census data on a map. A student...
Howard Hughes Medical Institute
Measuring Biodiversity in Gorongosa
Take your biology class' understanding of biodiversity to a whole new level! Ecology scholars use data to calculate three different diversity indices based on the organisms in the Gorongosa National Park. The four-part activity uses an...
Curated OER
Countries: Comparing and Contrasting
Students identify the seven continents, then choose countries to conduct research on. They write reports on their chosen countries, determining the population, location, and continent. As a class, students then compare/contrast countries.


