Curated OER
Observation
Students practice observation skills by discussing physical attributes of family artifacts. They determine what characteristics of an object are considered important details.
Curated OER
Picture This
A unique writing lesson, this plan begins with learners talking about multiculturalism in small groups. Each learner will choose a picture from a newspaper, describe it to their small group, and think about how it relates to...
Tidewater Community College
Assignment: The “Big Mac” Index
Young economists learn about the method of predicting changes in the exchange rate with Big Macs in an instructional video. After an understanding the index, learners write a post on a discussion board and respond to class members' posts...
PBS
Predicting/Making a Hypothesis
As an introduction to the hypothesis and testing method of investigation, young history detectives engage in a special investigation of a family artifact. After watching a short video that demonstrates the method, they develop a...
Curated OER
Elders Predict Snow
Students interview Native Indians to learn their ways for predicting and measuring snowfall. In this weather measurement lesson plan, students invite a Native Elder to their classroom to tell them about how they predicted weather....
Curated OER
Predicting: Making a Hypothesis
Students analyze information from various sources to create a hypothesis about the origin of a family artifact. Students create a hypothesis about the origin of the item and write a paragraph explaining why they believe the hypothesis is...
Curated OER
Using Primary Sources in the Classroom
Scholars study a historical photograph to make predictions of what happened right after the picture was taken. They research a variety of different topics and use primary sources to answer questions about common food, fashion trends, and...
Curated OER
Spreadsheets and Database in Social Studies
Fifth graders create/use spreadsheets to solve real-world problems, explore patterns and make predictions, select/explain most appropriate types of graph to display data, and enter data into a prepared spreadsheet to perform calculations.
Curated OER
How Much Water is Available in the Atmosphere for Precipitation?
Students explore the relationship between the amount of water in the atmosphere available for precipitation and the actual precipitation observed by satellite. They examine seasonal changes in precipitation. They practice using Internet...
Curated OER
Climate Change in My City
Students investigate the climate changes occurring locally, regionally and globally over the last one hundred years. They brainstorm and predict whether the current year's weather was warmer or colder than last year then check the...
PBS
Predicting/Making a Hypothesis
Students analyze information from a variety of sources in order to create a hypothesis about the origin of an interesting family artifact.They create alternative hypotheses based upon available information to demonstrate that some...
Curated OER
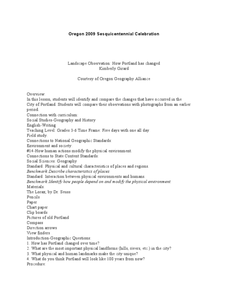
Landscape Observation: How Portland Has Changed
Learners read The Lorax and discuss how populations change the environment. Using given photos, students use a Venn Diagram to compare and contrast the Portland of yesterday to present day Portland. They write a comparison paper and...
Curated OER
Papel Picado ( Mexican Cut Paper)
Fifth graders describe the characteristics of a piece of "papel picado", or Mexican cut paper, which is seen in the Dia de los Muertos festival. They predict what medium was used in the papel picado art. They explain how the scene in the...
Curated OER
The Demographic Transition-A Contemporary Look at a Classic Model
Students evaluate and apply models to explain changes in global demographic patterns, and use their assessments to predict future needs.
Michigan Sea Grant
Exploring Watersheds
Collaboratively, students partake in a hands-on activity in which they build models of a watershed. Each group member draws an elevation map—a bird's eye view—of their model and predicts how water will flow from the high to low points....
Curated OER
How Do We Make Wise Decisions In Our World?
Third graders participate in a case study and use their problem solving skills to address the solution to a given situation. They consider how to survive in a foreign country, make economic decisions, and determine wise decisions for...
Curated OER
Geographic Themes From The Air: MOVEMENT
Young scholars observe a slide showing a shopping mall and the surrounding transportation network from an aerial perspective. They are asked to determine where stoplights would be located and predict future stoplight intersections.
Curated OER
Miao Minorities
Students conduct Internet research to identify the cultural aspects of the Miao minority group from China. They, in groups, create a brochure with their research and write an essay on the predicted future of the Miao culture.
Curated OER
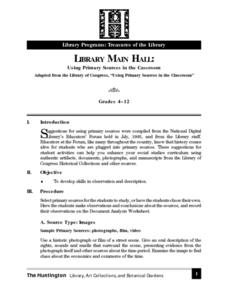
Library Main Hall: Using Primary Sources in the Classroom
Students choose a historical photograph or film and try to predict what happened after the photo or film in question.
Curated OER
When Youth Protest: Student Activism and the Mississippi Civil Rights Movement, 1955-1970
Learners explain the meaning of the following terms associated with the modern Civil Rights movement: segregation; integration; civil rights; civil disobedience.
Curated OER
Classroom Conservation
Fourth graders suggest ways paper and other natural resources can be used and recycled in the classroom. Students conduct a investigation into paper use and make distinctions among observations, conclusions (inferences), and predictions.
Curated OER
Litter Garden
Young scholars discuss what man-made and natural materials are visible in litter. Using a sample of litter, they review the concept of decomposition between the two types of materials. They examine the two samples once and a while and...
Curated OER
The World Almanac for Kids
Fifth graders identify and compare the features of The World Almanac for Kids in the print form and in the CD-ROM/ on-line form. They predict which format is the easiest to access and the most informative, then draw conclusions from...
Curated OER
Excel temperature Graphs
Students gather data about the weather in Nome, Alaska. In this Nome Temperature lesson, students create an excel graph to explore the weather trends in Nome. Students will find the average weather and add a trend line to their graph.


