Curated OER
Data Collection - Primary Poster
Students explore the concept of collecting, analyzing, and graphing data. In this collecting, analyzing, and graphing data lesson, students create a survey about a topic of interest. Students poll their classmates, analyze, and graph...
Curated OER
Statistical Analysis
In this statistics worksheet, students analyze the data provided in order to determine the null hypothesis, an alternate hypothesis, and the significant difference between the groups. The one page worksheet contains three scenarios with...
Curated OER
Remembering Our Veterans
Eighth graders research a variety of military statistics while using the theme of Remebering Our Veterans. They use data management to plan and create a PowerPoint presentation with their findings. They incorporate different types of...
Alabama Learning Exchange
Poppin' For Popcorn!
Students graph data from different popcorn flavors. In this graphing lesson, students make graphs using an assigned web site after collecting data about the flavors of popcorn that fellow classmates prefer.
Curated OER
A Picture's Worth a Thousand Words
Students analyze the numbers of male vs female administrators and teachers from their school. In this gender equality lesson plan, students use school yearbooks from the 1950's threw present to count how many male vs. female teachers,...
Curated OER
Planning a Trip
Learners collect data, organize data, and compute differences of multi-digit numbers. In this data analysis lesson plan, students put together their best travel plan in small groups as outlined in the first lesson plan. Learners study a...
Curated OER
Which Amusement Park Would You Choose?
Students analyze data related to amusement parks and create a spreadsheet to display the data. They read the data and predict which amusement park they think is safer, create a spreadsheet and graph, and write a proposal based on their...
Curated OER
The Perfect Principal
Students demonstrate their understanding of math skills. In this data analysis lesson, students complete a worksheet requiring them to calculate mean, median, and mode, and create and interpret graphs. Lesson is intended as an assessment...
Curated OER
Designing the Experiment and Answering the Question
Students investigate scientific methods by analyzing an article from the Natural Inquirer. In this data analysis lesson, students read an article from the magazine and discuss at least 2 scientific methods that could be used to solve...
Alabama Learning Exchange
Tiger Math Graphing
Learners practice various skills using the book Tiger Math: Learning to Graph from a Baby Tiger. After listening to the story, they create a pictograph using data collected from the text. They also color a picture of a tiger, collect...
Curated OER
Our Favourite Halloween Treat
Learners conduct a survey about Halloween candy and create a bar graph illustrating the data. In this data analysis lesson, stud nets are introduced to the topic with a discussion and survey, then the class creates a large graph and...
Curated OER
Religious Book Sales Climb
In this analyzing data worksheet, students review a graph from the USA Today. Students study the graph and answer four questions about the graph. There are also two extension questions included.
Curated OER
Designing a Germination Experiment
Students explore botany by participating in a seed experiment. In this plant nutrition lesson, students define several science experiment vocabulary terms like observation, treatment, and replicate. Students utilize soaked seeds in a...
Code.org
Finding Trends with Visualizations
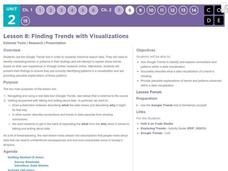
Pupils often hear about trends, but they don't always see them. The eighth lesson in a unit of 15 requires individuals to use the Google Trends tool. Class members identify patterns in the visualization before presenting the patterns...
Balanced Assessment
Oil Consumption
An assessment presents a chart displaying oil consumption Pupils use the chart to determine the greatest increase in consumption, and then apply that information to figure out when the consumption may reach 100 million barrels a day.
Curated OER
Rescue Mission Game
Students conduct probability experiments. For this rescue mission lesson, sudents play a game and collect statistical data. They organize and interpret the data and determine the probability of success. Students plot points on a...
Teach Engineering
Using Hooke's Law to Understand Materials
Provide a Hooke for a lesson on elasticity with an activity that has groups investigate a set of springs. They use a set procedure to collect data to calculate the spring constant for each spring using Hooke's Law. The groups predict the...
Equality and Human Rights Commission
Learning area 4: Learn About the Meaning of Community
Scholars examine the jobs found in their community by way of surveying. After collecting data, pupils analyze their findings and share their observations with their peers. A video sparks interest. Two posters motivate participants to...
Curated OER
Capacitors: What Are They?
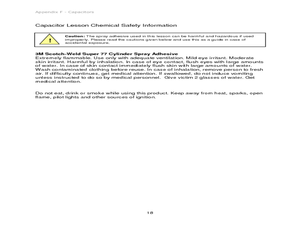
Students discover how capacitors help store data. In this computer science lesson, students investigate how capacitors can store an electronic charge, eventually helping computers store data. Students create their own capacitors with...
US Department of Commerce
Featured Activity: Exploring Questions for the 2020 Census
Just what is the census for? Using data and census questions, class members explore how officials gather information. Then, they consider how the government uses the answers to determine how it spends its money with a collaborative...
University of Colorado
Using Spectral Data to Explore Saturn and Titan
Saturn is really far away, but knowledge of its composition is within reach. Future astronomers learn how scientists use spectra to remotely determine the chemical composition of a planet or moon. They try out this concept by analyzing...
Curated OER
Microsoft Office Excel
Middle schoolers use Microsoft Office Excel. In this technology lesson, students enter data on a spreadsheet using Excel. This programs tallies data and presents it using graphs.
Curated OER
Weather Reporter
Fourth graders generate an oral presentation on the weather. In this weather lesson plan, 4th graders watch the weather for a week and record the data on a chart. Students give a weather report at the end of the week.
Curated OER
Hands on Habitat
Young scholars teach others about habitats. In this Science lesson, students use a Science Log to record data about a habitat for research. Young scholars analyze the data and construct an eco-chamber. Students share what they have found...


