Curated OER
Apple Logic and Problem Solving
Learners examine apple production in the United States. For this interdisciplinary lesson, students use problem solving strategies introduced to solve math problems associated with apple production in the United States. Student collect...
Yummy Math
Parametric Equations and a Heart
Trigonometry, art, and Valentine's Day come together in a creative activity about parametric equations. Learners calculate several equations before graphing them either by hand, on a graphic calculator, or Excel spreadsheet to curve...
Curated OER
The Sum of Our Integer Intelligences
Young mathematicians explore integers. They review adding integers through engaging in mathematical labs. Each lab station is designed to reflect one of the multiple intelligences. Resources for all activities are provided.
Yummy Math
A Cardioid for Valentine’s Day
It's Valentine's Day in geometry class! Celebrate the day of love with a heart-themed activity in which young mathematicians create a cardioid on polar graph paper.
Curated OER
Meatiest States: Graph Problem Solving
In this graph problem solving learning exercise, students analyze a graph that shows commercial red meat production in five states. Students answer 5 word problems using the data on the graph.
Curated OER
Your Tax Dollars at Work
In order to understand how tax dollars are spent, young economists use given data and graph it on a circle graph. Circle graphs are highly visual and can help individuals describe data. A class discussion follows the initial activity.
Curated OER
Using Supply and Demand to Analyze Exchange Rates
For this Using Supply and Demand worksheet, students draw curves and diagrams, make predictions about graphs, solve problems, and answer questions.
Curated OER
Making Graphs
Students explore statistics by conducting class demographic surveys. In this graph making lesson, students identify the family members of each classmate, pets they own, and favorite activities. Students organize their statistics and...
Curated OER
The Gathering and Analysis of Data
Young mathematicians gather data on a topic, graph it in various forms, interpret the information, and write a summary of the data. They present their data and graphs to the class.
Curated OER
Scaling it Down: Caves Have Maps, Too
Measurement and map skills are the focus of this lesson, where students crawl through a "cave" made out of boxes, desks and chairs, observing the dimensions. Your young geographers measure various aspects of the cave and practice...
Curated OER
Change for the future: Redesigning Maquoketa
Sixth graders research a problem to be solved in their town, develop a rationale as to why they should act on this problem, and present their ideas to the class and their community. In this problem solving lesson plan, 6th graders...
Curated OER
Demand and Supply Worksheet
In this economics worksheet, students use their problem solving skills to respond to 28 questions regarding demand and supply.
Curated OER
Supply, Demand, and Prices Worksheet
In this economics worksheet, students use their problem solving skills to respond to 34 questions about supply, demand and prices.
Curated OER
If It's to Be, It's Up to Me!
Eighth graders discuss the question: How does one become an effective decision-maker or problem solver in social situations? They are given three brief scenarios and after each one students are asked, "What would you do?" Students think...
Curated OER
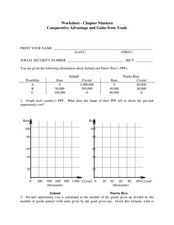
Comparative Advantage and Gains from Trade
Using a formula and several economic scenarios, learners answer six problem solving questions and finish a graph. They will use this activity to better understand comparative advantage and economic gains made through trade.
College Board
2017 AP® Macroeconomics Free-Response Questions
Learners get extra practice graphing complicated economic concepts using authentic College Board materials. Problem sets include examinations of consumer versus capital goods, and the effects of various financial policies on an economy...
Curated OER
Local Traffic Survey
Students conduct a traffic survey and interpret their data and use graphs and charts to display their results.
Curated OER
And Now…the Supply Curve!
For this economics worksheet, students use their problem solving skills to respond to questions regarding the supply curve and its impact on an individual's lemonade stand business.
Curated OER
Economics Worksheet: Opportunity Costs
In this economics worksheet, students use their problem solving skills to calculate opportunity costs and graph their calculations.
Education World
The African American Population in US History
How has the African American population changed over the years? Learners use charts, statistical data, and maps to see how populations in African American communities have changed since the 1860s. Activity modifications are included to...
Curated OER
Graphing Regions: Lesson 2
Students identify and analyze geographical locations of inventors. They each identify where their inventor is from on a U.S. map, discuss geographic patterns, and create a t-chart and graph using the Graph Club 2.0 Software.
Curated OER
Design Your Own Building
Students explore the use of design principles in the real world. They evaluate how problems can be solved using design principles. In groups, students design the floor plan for a building of their choice.
Curated OER
McCadam's Quarterly Report
Fourth graders problem solve a problem from a local business using data, generating graphs, and draw conclusions. They submit their findings in a business letter format with feed back from a company's plant manager.
Curated OER
Exchange Rate Problems
In this economics learning exercise, students respond to 10 short answer and multiple choice questions about exchange rates throughout the world.


