Curated OER
Mind Your Business
Students explore how to identify the range, median, and mode in a list of numbers by using concrete materials.
Curated OER
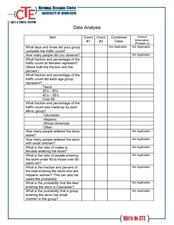
Data Analysis
For this data analysis worksheet, students complete several activities to analyze data. Students calculate the mean, median, mode, and range for the 14 problems.
Curated OER
Not Just an Average Class
Fourth graders work together to find the median, mode, and mean of their first and last names using a numerical code in this fun, interactive lesson plan. After a lecture/demo, 4th graders utilize a worksheet imbedded in this plan to...
Curated OER
Central Tendencies and Normal Distribution Curve
Fourth graders are given data (class test scores) to determine central tendencies, and find information needed to construct a normal distribution curve. They become proficient in calculating mode, median and average.
Curated OER
Statistical Specimens
Third graders are introduced to statistical vocabulary. They complete an online activity that asks them to calculate the mean, median and mode for a set of data.
Curated OER
Stem-and-Leaf Plots
Students are introduced to stem-and-leaf plots and calculating the mean, median, and mode from the plots.
Curated OER
Worksheet 2.4/2.5: MT-A141 PreCalculus
For this precalculus worksheet, students use their graphing calculator to graph the domain and range of given terms. They write parametric equations and identify the coordinates of the points on the relation given certain terms.
Curated OER
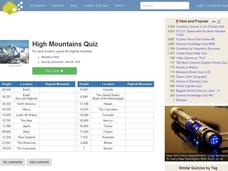
High Mountains Quiz
In this online interactive geography quiz learning exercise, students respond to 18 identification questions about the highest mountain ranges in the world. Students have 4 minutes to complete the quiz.
Curated OER
Math: Giant Alaskan Cabbages
Students analyze data from the Alaska State Fair's "Giant Cabbage Weigh-Off." Once they have sorted the weights, they calculate the range, mean, mode, and median of the cabbages. Finally, students create posters displaying their...
Curated OER
Center of Mass
Young scholars identify the geometric mean of their data. In this statistics instructional activity, students collect data and graph their findings. They identify the mean, range and mode.
Curated OER
Mean, Mode, Range, Median
In this weather worksheet, students look at the average monthly temperatures and precipitation for their own city to determine the mean, mode, range, and median. This worksheet has 8 fill in the blank questions.
Curated OER
Data Analysis
In these analyzing data worksheets, learners complete a table and a pie chart and calculate mean, median, mode, and range for sets of data.
Curated OER
Estimation & Central Tendency
Eighth graders view pictures that show many objects, estimate amount that they think they saw, and take class data from estimation to find the mean, median, mode, and range for the class.
Curated OER
Capture/Recapture
Learners use proportions to estimate the size of populations. They describe the data with using a graph or table of the estimate. Students use descriptive statistics to calculate mean, median, and mode. They also compare and contrast an...
University of Pennsylvania
Canaan and Ancient Israel
Planning for your next activity on ancient Israel, but not sure where to start? Check out this assortment of activities to help get the ball rolling. It includes a range of ideas on topics, such as Greek and Egyptian mythology,...
Curated OER
Central Tendency
Fifth graders compare and contrast different sets of data on the basis of measures of central tendency.
Curated OER
An Introduction to Elementary Statistics
Students explain and appreciate the use of statistics in everyday life. They define basic terms used in statistics and compute simple measures of central tendency.
Curated OER
Holly Leaves
Sixth graders analyze mathematics by participating in a botany activity. For this holly lesson, 6th graders identify if all holly leaves have the same amount of prickles by conducting a math survey. Students analyze many leaves and...
Curated OER
Record 'The' Results
Third graders predict how many times they'll see the word "the" in a newspaper page and highlight all the "the"s they find. After reviewing definitions of range, median, mode, mean they create a Stem and Leaf Plot and a Back-to-Back Stem...
Curated OER
Box Plots
Learners review the concept of median, explore how to calculate quartiles for any size data set and experience how to build a box plot.
Curated OER
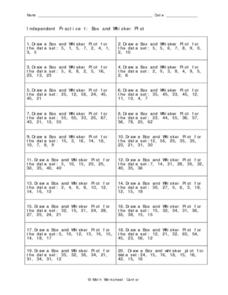
Independent Practice 1: Box and Whisker Plot
For this box and whisker plot worksheet, students create a box and whisker plot from a given set of data. They identify the lower quartile, upper quartile, the mean, and outliers. This one-page worksheet contains 20 sets of numbers...
Inside Mathematics
Suzi's Company
The mean might not always be the best representation of the average. The assessment task has individuals determine the measures of center for the salaries of a company. They determine which of the three would be the best representation...
Polar Trec
How Much Data is Enough?
The next time you read a magazine or watch the news, make note of how many graphs you see because they are everywhere! Here, scholars collect, enter, and graph data using computers. The graphs are then analyzed to aid in discussion of...
NASA
Exploring Data
Bring the sun to your class! Young scholars analyze actual solar wind data in the second lesson of a five-part series. Their analysis includes speed, temperature, and density data.
Other popular searches
- Mean Median Mode Range
- Mean, Median, Mode Range
- Mean, Median, Mode, Range
- Median Mode Range
- Mean Median Mode and Range
- Mean, Median, Mode, and Range
- Mode and Range
- Median Mode and Range
- Mean, Median, Mode and Range
- Median, Mode, Range


