Curated OER
Drive the Data Derby
Three days of race car design and driving through the classroom while guessing probability could be a third graders dream. Learn to record car speed, distances traveled, and statistics by using calculation ranges using the mean, median,...
The New York Times
The Careful Reader: Teaching Critical Reading Skills with the New York Times
The 11 lessons in this educators' guide focus on using newspapers to develop critical reading skills in the content areas.
Columbus City Schools
Speed Racers
Who wants to go fast? The answer? Your sixth-grade science superstars! The complete resource offers the ultimate, all-inclusive playbook for mastering the important concepts of speed versus time; distance versus time; and how...
Beyond Benign
Municipal Waste Generation
Statistically, waste may become a problem in the future if people do not take action. Using their knowledge of statistics and data representation, pupils take a look at the idea of waste generation. The four-part unit has class members...
Mathematics Vision Project
Features of Functions
What are some basic features of functions? By looking at functions in graphs, tables, and equations, pupils compare them and find similarities and differences in general features. They use attributes such as intervals of...
Mathematics Vision Project
Module 3: Features of Functions
Learn how to represent functions in multiple ways. Learners analyze functions as equations, graphs, and verbal descriptions. The analysis includes intercepts, behavior, domain, and range. The module of seven lessons makes up the third...
Mathematics Vision Project
Module 2: Systems of Equations and Inequalities
The brother-sister pair Carlos and Clarita need your class's help in developing their new pet sitting business. Through a variety of scenarios and concerns presented to the siblings, the learners thoroughly explore systems of equations...
Benjamin Franklin High School
Saxon Math: Algebra 2 (Section 9)
Section 9 of the 12 linked Saxon Math sections introduces the young algebrist to graphing periodic functions, creating graphs from quadratic roots, working with inequalities, and rational equations. Common among all the lessons is the...
Blake Education
Harry Potter and the Philosopher’s Stone
The motto for Hogwarts School of Witchcraft and Wizardry warns that one should never tickle a sleeping dragon, but learners will definitely be tickled by the activities in a packet of materials designed to accompany a reading of the...
New York City Department of Education
Grade 5 Literacy in Science: Ecosytems
How do humans affect ecosystems? Learners read two articles and interpret a graph to develop essays on the human impact on ecosystems. They read about human impact on tigers and manatees as a basis for their overarching papers.
Intel
Choreographing Math
Leaners investigate families of linear functions through dance. They choreograph dance moves to model nine unique linear functions of their choosing. Using their dance moves, teams create a video presentation complete with music and...
Mathematics Vision Project
Linear and Exponential Functions
Provide a continuous progression to linear and exponential functions. Pupils continue to work with the discrete functions known as sequences to the broader linear and exponential functions. The second unit in a series of nine provides...
Curated OER
Second Graders Create Their Own Social Studies Book (Part I, The 5Ws of the Constitution)
Students develop their own social studies textbook using a blank theme book as they complete activities and learning experiences throughout the year. The activities are in art, music, simulations, read alouds, shared writing and a class...
Curated OER
How Does Your Garden Grow?
Students complete activities to learn about the life cycle of a seed. In this plant growth lesson, students complete activities for the life cycles of seeds.
Curated OER
The Four Seasons with "Charlotte's Web"
Students explore the characters and plot of the story, "Charlotte's Web" through the twenty-two lessons of this unit. Characters, facts, and details of the story are recalled and discussed and form the basis of several activities in this...
Education Development Center
Tune in to Learning: Reading Charts and Graphs
Practice graph reading skills with these exercises and companion tutorials.
Khan Academy
Khan Academy: Read Histograms
Practice reading and interpreting histograms. Students receive immediate feedback and have the opportunity to try questions repeatedly, watch a video or receive hints.
CK-12 Foundation
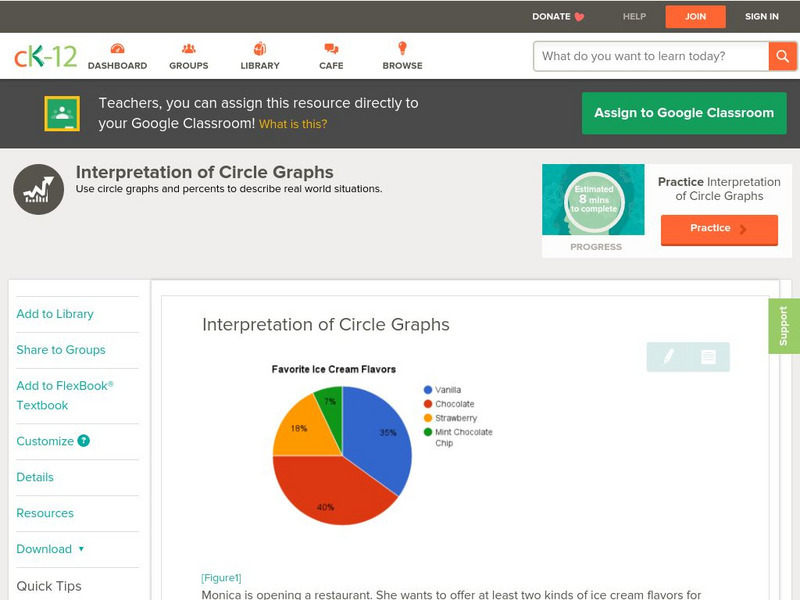
Ck 12: Statistics: Interpretation of Circle Graphs Grades 6 7
[Free Registration/Login may be required to access all resource tools.] Read and interpret circle graphs.
Khan Academy
Khan Academy: Interpreting Graphs of Proportional Relationships
Practice reading and analyzing graphs of proportional relationships. Students receive immediate feedback and have the opportunity to try questions repeatedly, watch a video or receive hints.
Khan Academy
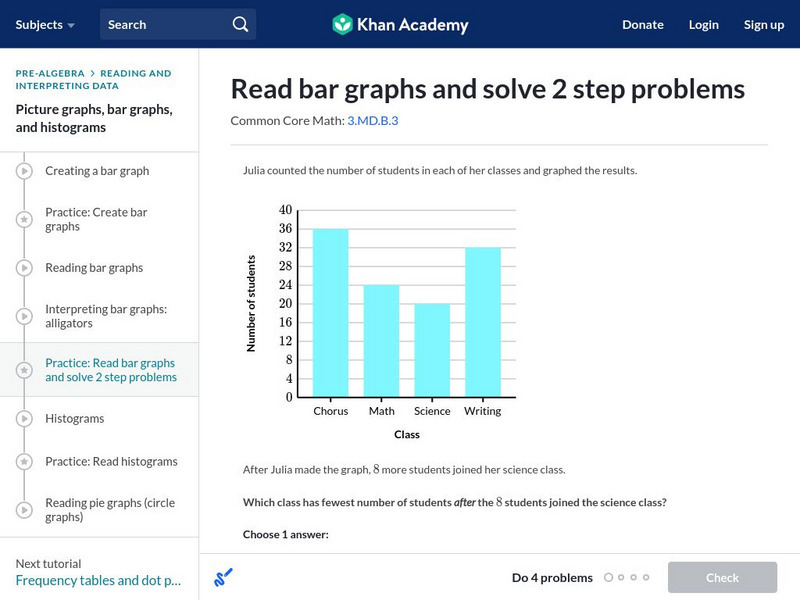
Khan Academy: Read Bar Graphs and Solve 2 Step Problems
Read and interpret a double bar graphs. Students receive immediate feedback and have the opportunity to try questions repeatedly, watch a video or receive hints. CCSS.Math.Content.3.MD.B.3 Draw a scaled picture graph and a scaled bar...
Khan Academy
Khan Academy: Solve Problems With Bar Graphs 1
Read and interpret bar graphs. Students receive immediate feedback and have the opportunity to try questions repeatedly, watch a video or receive hints.
Texas Education Agency
Texas Gateway: Analyze Graphical Sources: Practice 2 (English I Reading)
This lesson focuses on practice exercises to understand and interpret the data in a graphic representations including pie charts, bar graphs, and line graphs.
Khan Academy
Khan Academy: Solve Problems With Picture Graphs 1
Read and interpret picture graphs. Students receive immediate feedback and have the opportunity to try questions repeatedly, watch a tutorial video, or receive hints.
Texas Education Agency
Texas Gateway: Evaluating Data in Tables, Graphs and Charts
[Accessible by TX Educators. Free Registration/Login Required] In this lesson students look at examples of graphics, tables, charts, and graphs, and learn how to interpret their data. They will be able to use this skill to enhance their...


