Curated OER
"Samantha Loves Cookies"
For this math problem solving worksheet, students read a bar graph showing numbers of different kinds of cookies to solve word problems. Students solve 7 problems.
Curated OER
ABC...Have Fun With Me!
Throw out those old ABC worksheets and try some new and engaging hands-on activities to teaching the alphabet!
Curated OER
Graphing Using Cookies
Students differentiate between bar graphs, line graphs, pictographs and bar graphs. After participating in a hands-on cookie activity, students label and draw their own graphs.
Curated OER
Wheat Kernels Bar Graph
Third graders create a bar graph to record how many kernels were in a wheat stalk. They write in math journals two questions from interpreting the graph. They solve math problems from other students.
Curated OER
Graphing Data
First graders learn how to display data using a bar graph. In this bar graph lesson, 1st graders use data from a t-shirt color survey to make a bar graph. They also make an animal bar graph before interpreting the information.
Curated OER
Graphs
Middle schoolers investigate circle and bar graphs. In this middle school mathematics lesson, students determine which kind of graph is suitable for a given situation and create circle and bar graphs.
Curated OER
Graphing Our Favorites
Second graders use a computer program to follow directions and graph their favorite things into a bar graph. In this graphing lesson plan, 2nd graders have 30 choices of favorite things to graph.
Curated OER
Horizontal Bar Graph: Changes in Nebraska Population
In this bar graph learning exercise, students learn about the changes in Nebraska's population from 1880 to 2000 by studying a bar graph. Students answer 7 questions about the graph.
Curated OER
Step Into My Shoes
Students order their classmates from smallest to largest foot length. In this ordering their classmates from smallest to largest foot length lesson, students trace each of their classmates foot. Students read a story called,...
Curated OER
Applied Science - Science and Math Lab
Students make a prediction. In this applied science lesson, students guess the number of items in a jar. Students create a bar graph to show the predictions and the actual amounts.
Curated OER
Hollywood's Top Ten
Students gather data on top 10 highest grossing movies, and make a bar graph and a pictogram.
Curated OER
Graphic Accounts
Students identify the use of different types of bar graphs. They analyze graphs used in the New York Times to compare the estimated cost of the war in Iraq to other hypothetical expenditures and reflect on how graphs can help illustrate...
Curated OER
Food for Class Party
In this interpreting a bar graph and math word problems worksheet, 2nd graders read the information about choices of food for a class party and answer various multiple choice questions. Students solve 25 problems.
Curated OER
Reading and Interpreting Graphs Worksheet
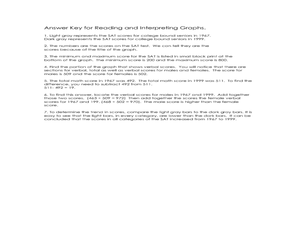
In this bar graphs worksheet, students read and interpret a bar graph on SAT scores by answering short answer questions. Students complete 7 questions total.
Curated OER
Problem Solving: Use a Graph: Problem Solving
In this bar graph activity, students read the word problem and use the bar graph to complete the problem solving questions for understand, plan, solve, and look back.
Curated OER
Seized Before Flights: Graph
In this bar graph worksheet, students analyze a graph that show the number of prohibited items intercepted at U.S. airport screening checkpoints. Students answer 3 problem solving questions about the data on the graph.
Curated OER
Statistics Problems
In this statistics instructional activity, 3rd graders answer questions about different graphs including bar graphs, picture graphs, line graphs, and more. Students complete 20 multiple choice questions.
Curated OER
Interpreting Data from Birdfeeders
What kinds of birds live in your area? Read a book about birds to your learners and explore their feeding patterns. Charts and graphs are provided in this three page packet, but consider assigning the basic questions if using with young...
Curated OER
And the Survey Says...
Create a survey and graph! In this graphing lesson, students listen to a story about pets, create a survey for family and friends about what pets they own, and use the information to create a bar and line graph.
Mathed Up!
Tallys and Charts
After watching a brief instructional video, young mathematicians are put to the test. By completing and reading frequency tables, tally charts, and bar graphs, individuals show their understanding of how to interpret data.
Museum of Tolerance
Where Do Our Families Come From?
After a grand conversation about immigration to the United States, scholars interview a family member to learn about their journey to America. They then take their new-found knowledge and apply their findings to tracking their family...
Curated OER
Science: Teddy Bear Nation
Students sort teddy bears according to types and then graph the results. They each bring a bear to class and then discuss their similarities and differences. Once the bears have been sorted into groups according to size and color,...
August House
Why Koala Has a Stumpy Tail
Learn about the animals of Australia with a language arts lesson about an Australian folktale called, Why Koala Has a Stumpy Tail. After reading the story as a class, kids discuss events and characters from the book, retell the...
Curated OER
Bar Graphs
Students perform operations and graph their data using charts and bar graphs. In this algebra lesson, students follow specific steps to make a bar graph. They create a survey about people favorite things and plot their data from the...


