Mathed Up!
Inequalities Regions
Discover how to solve systems of inequalities by graphing. An informative video shows pupils how to determine the solution set after graphing each inequality of a system. To finish, a worksheet gives them a chance to practice this skill.
Curated OER
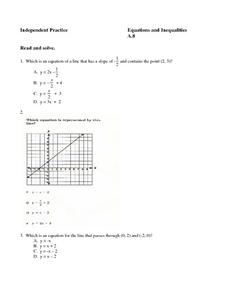
Equations: Graphs, Lines, Slope
In this equations instructional activity, students complete 8 multiple choice questions regarding writing equations in slope-intercept and matching an equation to its graph in the coordinate plane.
Curated OER
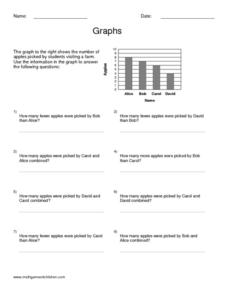
Bar Graphs
In this bar graphs worksheet, pupils, working with a partner, explore how to read and analyze the five answers to one mathematical bar graph.
Curated OER
Classroom Supplies
Challenge young mathematicians to buy classroom supplies by staying within the means of a $1,000 budget. The mathematical activity provides learners with the opportunity to decide what items from the supply list would benefit a class of...
EngageNY
Real-World Positive and Negative Numbers and Zero
Class members investigate how positive and negative numbers are useful in the real world. Individuals first read a short passage and identify terms indicating positive and negative numbers. They consider situations involving positive...
Curated OER
Scientific Observation of Force and Acceleration on an Object
In this force and acceleration worksheet, 8th graders answer ten questions based on two graphs. The first graph is a scatter plot, the second is a line graph.
Curated OER
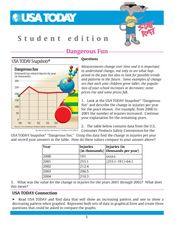
Dangerous Fun
For this line graph worksheet, students analyze the data on a graph about toy-related injuries by year. Students solve 5 problems in which the change in injuries per year is calculated and recorded on a table.
Curated OER
Interpreting Graphs: Temperate Climates
In this interpreting graphs worksheet, students read a graph containing data of rainfall and temperature, then complete 18 questions, interpreting the data.
Teach Engineering
Forms of Linear Equations
Linear equations are all about form. The fifth part in a unit of nine works with the different equivalent forms of linear equations. Class members become familiar with each form by identifying key aspects, graphing, and converting from...
Illustrative Mathematics
Walk-a-thon 1
Your mathematician's job is to explore the relationship between hours and miles walked during a walk-a-thon. The activity compels your learners to experiment with different means in finding out this proportional relationship. The answer...
MCAS Mentor
Number Sense and Operations
In this number sense and operations instructional activity, learners solve 15 different types of problems that include reading number lines and solving inequalities. First, they write the scientific notation of various numbers given....
Sinclair Community College
Solving Linear Inequalities
Your learners will appreciate the complete picture of linear inequalities presented in this lesson plan. Starting simply with definitions and moving all the way to solving linear inequality word problems this activity is simple to follow...
Curated OER
Graphs
In this graphs worksheet, 10th graders identify and solve 10 different problems that include reading various graphs of lines. They determine the equation for each graph whether it is dealing with tangent, cotangent, secant or cosecant.
Curated OER
Using A Table
In this table activity, students observe information in a table, and then answer ten questions pertaining to the information. They must correctly read a table in order to arrive at the correct answer. Questions pertain to features of a...
Curated OER
Graphs
In this algebra instructional activity, students calculate the point of intersection between a circle and a straight line. There are 5 questions with an answer key.
Curated OER
Using Data To Make Graphs
In this using data to make graphs worksheet, students interactively answer 10 multiple choice questions then click to check their answers.
Public Schools of North Carolina
Math Stars: A Problem-Solving Newsletter Grade 3
Make sure your class stays up with the times using this series of math newsletters. Including word problems that cover topics ranging from consumer math and symmetry to graphing and probability, these worksheets are a fun way to...
Curated OER
Sunshine Math 3
In this word problems instructional activity, learners read and problem solve nine mathematical word problems involving grids, measurement, compensation and angles.
Curated OER
Dice Word Problems
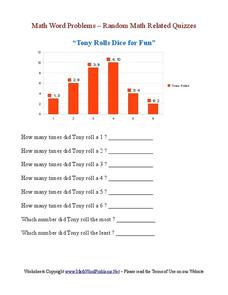
In this dice word problem worksheet, students answer a set of 8 questions related to a line graph showing rolls of a dice. A reference web site is given for additional activities.
Yummy Math
Deflate-gate
Does temperature affect the air pressure of a football? Young mathematicians look at the readings from a pressure gauge and determine if the balls are within regulation or are under inflated.
Charleston School District
Sketching a Piecewise Function
How do you combine linear and nonlinear functions? You piece them together! The lesson begins by analyzing given linear piecewise functions and then introduces nonlinear parts. Then the process is reversed to create graphs from given...
California Education Partners
Science Fair Project
Plant the data firmly on the graph. Given information about the growth rate of plants, pupils determine the heights at specific times and graph the data. Using the information, scholars determine whether a statement is true and support...
West Contra Costa Unified School District
Slope-Intercept Sort
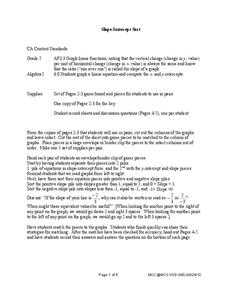
What's so special about slope? Pupils first match cards with slope and y-intercept to graphs of linear equations. They continue the lesson by matching equations in slope-intercept form to the same graphs.
EngageNY
Lines That Pass Through Regions
Good things happen when algebra and geometry get together! Continue the exploration of coordinate geometry in the third activity in the series. Pupils explore linear equations and describe the points of intersection with a given polygon...


