Curated OER
What's The Weather?
Second graders record and summarize daily weather observations for a week in the form of a bar graph. They cut and glue a weather symbol for each day, record it on the graph, and answer discussion questions.
Curated OER
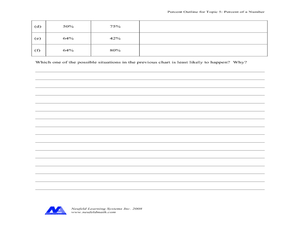
Percent of a Number
For this percent worksheet, students complete problems such as changing percents to decimals, filling in percentage charts, and more. Students complete 8 problems.
Curated OER
Science and Technology
Pupils research inventions that have been created. In this historical technology instructional activity, students read the Harcourt Brace social studies textbook and discuss how inventors used graphs to display data. Pupils create a...
Curated OER
Weather Awareness
Second graders investigate weather. In this weather lesson, 2nd graders discover how to read a temperature gauge, keep track of the weather, and find out how the weather affects their day. They work individually and in partners to make...
Curated OER
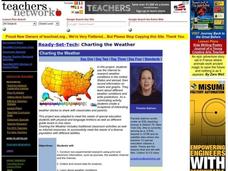
Charting the Weather
Students research and conduct non-experimental research, such as journals, the weather channel and the internet, to collect and record data for analysis on weather conditions in the United States and abroad. They identify, pronounce and...
Curated OER
A Creative Presentation
Bring writing to life with this lesson in which elementary and middle schoolers create a display of the imagery they identify in a series of Gary Paulsen books. They read the suggested materials, identify imagery and descriptive...
Curated OER
Graphing
Fifth graders create graphs based on climate in South Carolina. They read and interpret information in a chart and construct a graphy from the information in the chart. They create a spreadsheet using Excel and publish 2 graphs.
Curated OER
The Guise of a Graph Gumshoe
Eighth graders practice constructing bar, circle, and box-and-whisker graphs. They practice reading and interpreting data displays and explore how different displays of data can lead to different interpretations.
Curated OER
Delicious Graphing
Fourth graders sort trail mix by type and use that information to create different types of graphs for comparing.
Curated OER
Graph Your Foot!
Students measure their own foot and place the outline on a graph. They make connections between the size of their foot and the bar graph that represents it.
Curated OER
Our Favorites
Students participate in and conduct a survey to determine various class favorites. They collect, organize and display their data, interpret the results, and complete a packet of worksheets to display the information.
Curated OER
Getting There
Students practice reading a pictograph. In this data analysis lesson plan, students collect data and create their own pictograph. A students worksheet is included.
Curated OER
Obstacles to Success: Misleading Data
Eleventh graders explore how data reported by country agencies can mislead the public intentionally or unintentionally. In this Cross Curricular activity, 11th graders analyze charts and graphs in order to draw conclusions. Students...
Curated OER
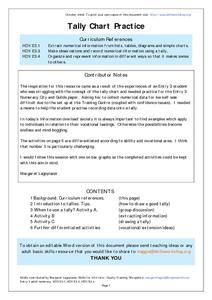
Tally Chart Practice
In this tally chart worksheet, students will read about tally charts and their uses. Students will make a list of when and why they could make a tally chart. Next students will complete a tally chart and write statements about the...
Bowland
Mystery Tours – Plan Your Tour
Everyone loves a vacation and a set of three activities has groups planning a tour of the U.K. using given distance, time, and price data. They solve a variety of problems related to the trip and produce a report on the success of...
Curated OER
Dragonwings: Explore Chapters 1-5
If you are beginning Laurence Yep's Dragonwings, this will provide activities for the first five chapters. The objectives include making connections to oneself and the world, organizing information and events, vocabulary acquisition,...
Curated OER
Chapter 10: Aggregate Expenditures (The Multiplier, Net Exports, and Government)
Effectively portraying the multiplier effect and the gaps within recession and inflation periods, these slides would be a good resource for both a beginning and advanced economics class. Clear, easy-to-read graphs and charts take viewers...
Curated OER
Chapter 17: Economic Growth and the New Economy
Is economic growth necessary to remain a relevant world power? These slides discuss the definition and implications of growth economics, complete with global comparisons and ways to account for growth. Graphs and charts are easy to read...
Serendip
Changing Biological Communities – Disturbance and Succession
After cutting down a forest to make a farm, how long would it take the environment to turn an abandoned farm back into a forest? Scholars study this exact scenario while they interpret many charts and graphs of the changing ecosystems as...
Curated OER
Weather Lesson
Students discuss the weather conditions. They read thermometer, rain gauge, barometer, and wind direction and speed. They record observations of weather conditions and enter information into data base on the computer.
Curated OER
Death by Particles
Emerging epidemiologists define relative risk and read an article about the effect of particulate pollution on the cardiovascular health of women. They record the relative risk values, graph them, and answer analysis questions. This is a...
Curated OER
School Yard Waste
Fourth graders examine the types of garbage that they collect on the playground. They collect the information in a spreadsheet and create a graph that displays the number of types of trash found. They design and monitor a playground...
Curated OER
Mmm, Mmm, M&M's
Here is another version of the classic M&M math lesson. In this one, upper graders utilize the ClarisWorks Spreadsheet program in order to document the data they come up with from their bags of M&M's. After making their initial...
Curated OER
East Asia & The World
Students discuss the relationships between East Asia and the United States. They examine the importance of trade and politics. They examine graphs and charts of certain aspects of the region and discuss.


