ARKive
Handling Data: African Animal Maths
Handling and processing data is a big part of what real scientists do. Provide a way for your learners to explore graphs and data related to the animals that live on the African savannah. They begin their analysis by discussing what they...
Curated OER
The Hajj: Muslim Pilgrimage in a Geographic Perspective
Young scholars read information on the Hajj. They discuss pilgrimage and ways it differs from going to a church, mosque or synagogue. Students discuss logistical problems that might be posed for the host country of a pilgrimage. Young...
Curated OER
Understanding "The Stans"
Young scholars explore and locate "The Stans" in Central Asia to create, write and illustrate maps, graphs and charts to organize geographic information. They analyze the historical and physical characteristics of Central Asia via...
iCivics
The Fourth Branch: You!
Take time to remind your young learners of the valuable understanding that each branch of the United States government is really composed of other citizens. The reading material and worksheets of this resource cover the importance of...
Curated OER
It's Your Life - Safe or Sorry/Safety Issues
Students examine and chart data about safety hazards and unsafe situations. In this safety hazard instructional activity, students examine newspapers and web sites to investigate injuries from safety hazards. They make a spreadsheet...
Curated OER
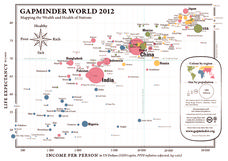
Gapminder World 2012
Here is a very interesting infographic that compares the average life expectancies, per capita incomes, and population sizes of every country in the world in 2012.
Curated OER
Constitution/Impeachment/Reconstruction
Eleventh graders analyze a chart comparing U.S. census data from 1850, 1880, 1900, and 1920. They read a handout summarizing immigration legislation from 1882-1996 and create a graph charting how open / closed U.S. immigration is over time.
Workforce Solutions
A Colony for Lunar Living
Two lessons explore the possibility of living on the moon. First, scholars read various scenarios to identify which careers would best transfer to life in space. Finally, pupils examine a website to locate items made for outer space,...
Curated OER
Ancient Greece and Ancient Rome Unit Plan
Students make two T charts, one for Sparta and one for Athens, showing pros and cons for living in either city-state. They use the physical information from the map and the cultural captions given for Athens and Sparts to come to their...
Curated OER
Perceived Risks
Students rank a list of everyday risks to compare with classmates. They rate each risk on both its ability to be controlled and its observability in the environment. Results are graphed.
Curated OER
Women in Texas Politics: Winning the Vote, Three Pioneers, and Serving the People
Fourth graders study women's involvement in Texas politics. In this US history lesson, 4th graders discuss woman suffrage, examine three Texas female pioneer legislators by reading biographies, and explore women's issues by generating a...
Curated OER
Las Tejanas
Fourth graders recognize that the Tejanas were Texas women of Spanish-Mexican origin who contributed to the history of Texas. Students read and research the Tejanas women, complete an essay about a day in the life of a Tejanas woman ,and...
Baylor College
Body Mass Index (BMI)
How do you calculate your Body Mass Index, and why is this information a valuable indicator of health? Class members discover not only what BMI is and practice calculating it using the height and weight of six fictitious individuals, but...
Curated OER
Math Made Easy
Students evaluate word problems. In this problem solving lesson plan, students are presented with word problems requiring graphing skills and students work independently to solve.
Curated OER
Survey Say...
Young scholars examine a variety of charts and graphs that present data in a format that is easy to read. They work in groups to conduct a survey amongst their classmates. The data collected from the survey is then put on a bar graph.
Curated OER
What's Your Favorite Planet?
Fourth graders interpret a graph and make correlations using data. After taking a class survey, 4th graders create a class graph of their favorite planets. Working in small groups, they interpret the information and create at least ten...
Curated OER
Snow Cover By Latitude
Pupils examine computerized data maps in order to create graphs of the amount of snowfall found at certain latitudes by date. Then they compare the graphs and the data they represent. Students present an analysis of the graphs.
Curated OER
Let's Line Them Up!
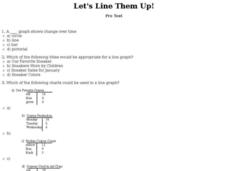
In this line graph worksheet, learners read through the problems about graphing and line graphs. Students select the best answer to solve the 10 online questions.
Curated OER
Apple Eaters
Students sample a variety of apples and graph group results for the class favorites. They orally explain the graph.
Curated OER
Creating and Analyzing Graphs of Tropospheric Ozone
Students create and analyze graphs using archived atmospheric data to compare the ozone levels of selected regions around the world.
Curated OER
Introduction to Graphical Representation of Data Sets in Connection to Cellular Growth
Students practice graphing relationships between variables by studying topics such as exponential growth and decay. They conduct a series of numerical experiments using a computer model and a variety of physical experiments using mold,...
Curated OER
Speedy Readers
Students read orally to increase their reading speed and fluency in this lesson. They listen to the teacher model expressive and fluent reading. They then practice reading orally with a partner. The partner times their reading with...
Curated OER
Using My Nasa Data To Determine Volcanic Activity
Young scholars use NASA satellite data of optical depth as a tool to determine volcanic activity on Reunion Island during 2000-2001. They access the data and utilize Excel to create a graph that has optical depth as a function of time...
Curated OER
Education for Global Peace
Fifth graders construct data graphs based upon sets of data. In this graphing lesson, 5th graders read the text If the World Were a Village and discuss how types of graphs accurately represent a large population. Students construct their...


