Alabama Learning Exchange
Human Slope
Middle and high schoolers explore the concept of slope. In this slope lesson, learners graph lines using a life-size graph. They use chalk on a blacktop to create a coordinate plane and use each other as the tick marks on the grid....
Achievement Strategies
CCSS Unit Design Template for PE
From baseball and tennis to capture the flag and four-square, here is a great document that will help you design your next unit on a sport-related activity.
Teach Engineering
Preconditioning Balloons: Viscoelastic Biomedical Experiments
What does stretching a balloon have to do with equilibrium? Groups explore preconditioning by stretching a balloon to a point of equilibrium. They then measure the amount of force required to stretch the balloon to the same point several...
National Academy of Sciences
Lights at Night Webquest
Help learners find ways to become more efficient energy consumers. To start, individuals research how different countries address energy efficiency and then analyze their own carbon footprint. They use their research to identify ways to...
Population Connection
The Peopling of Our Planet
How many people live on the planet, anyway? The first resource in a six-part series covers the topic of the world population. Scholars work in groups to conduct research and make population posters after learning about the global...
Virginia Department of Education
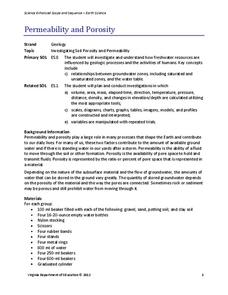
Permeability and Porosity
Covering both permeability and porosity, scholars perform a hands-on experiment testing various soil types. The material includes a pre-lesson worksheet to help focus pupils on the task at hand.
Statistics Education Web
How Wet is the Earth?
Water, water, everywhere? Each pupil first uses an Internet program to select 50 random points on Earth to determine the proportion of its surface covered with water. The class then combines data to determine a more accurate estimate.
Curated OER
Favorite Animal at the Zoo - Making a Pie Chart
In this graphing and interpretation worksheet set, students draw charts that are either blank or outlined that show information about students' favorite zoo animals. They answer questions based on the data in 15 examples.
Curated OER
Electromagnets: Winding Things Up!
Students explore solenoids and electromagnets. After building an electromagnet, students use a TI Graphing calculator, a CBL 2 interface and a magnetic field sensor to measure the strength of a magnetic field. They create a graph of...
Curated OER
Valentine Candy Count
Young scholars investigate what color Valentine Candy is found more often than any other in a standard bag of "Valentine Conversation Hearts." They sort, classify and graph their findings.
Curated OER
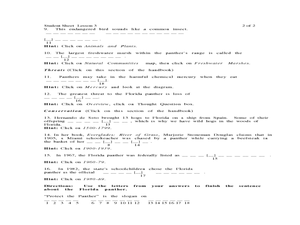
Panther Scavenger Hunt
Pupils research a website to learn about the Florida panther. In this animal research instructional activity, students use the scavenger hunt directions to search a website about Florida panthers. Pupils also solve word puzzles within...
Curated OER
Oat Seed Lab: A Model Scientific Experiment
Students investigate seed germination. In this lesson plan on scientific prediction, students conduct a scientific experiment using oat seeds.
Curated OER
Using My Nasa Data To Determine Volcanic Activity
Young scholars use NASA satellite data of optical depth as a tool to determine volcanic activity on Reunion Island during 2000-2001. They access the data and utilize Excel to create a graph that has optical depth as a function of time...
Curated OER
Dental Detectives
First graders explore the theme of dental health and hygeine. They make tooth loss predictions, count lost teeth, and graph tooth loss. In addition, they listen to dental health stories, read online stories, create spreadsheets, and play...
Curated OER
Systems of Equations: What Method Do You Prefer?
Students explore the concept of solving systems of equations. For this solving systems of equations lesson, students watch YouTube videos about how to solve systems by graphing and by elimination. Students use an interactive website to...
Achieve
Greenhouse Management
Who knew running a greenhouse required so much math? Amaze future mathematicians and farmers with the amount of unit conversions, ratio and proportional reasoning, and geometric applications involved by having them complete the...
Curated OER
Does Your Field Measure Up
Young scholars measure angles using a plane table kit. In this geometry lesson, students use trigonometric identities to find the values of the length of a football field.
Curated OER
Snow Cover By Latitude
Pupils examine computerized data maps in order to create graphs of the amount of snowfall found at certain latitudes by date. Then they compare the graphs and the data they represent. Students present an analysis of the graphs.
Curated OER
No Title
Sixth graders, after reviewing and studying the basics of recording, analyzing and presenting data, create on graph paper a bar or line graph to represent given data and then interpret the data. They answer questions about the given data...
Curated OER
Investigating Motion, Forces, and Energy Lab Book
Eighth graders create their own experiements using toy trucks, cars or balls to measure the time it takes two of them to travel 5 meters, as well as at each 1 meter interval. They make use computers to make a time/distance graph and...
Curated OER
McCadam's Quarterly Report
Fourth graders problem solve a problem from a local business using data, generating graphs, and draw conclusions. They submit their findings in a business letter format with feed back from a company's plant manager.
Curated OER
Velocity vs. Time
Twelfth graders read and interpret v-t graphs. After studying velocity and time, 12th graders read graphs to calculate the acceleration of a moving body and determine the distance and displacement of a body. Students explore the...
Curated OER
Mountain of Ice
Pupils graph and analyze chemical concentrations from ice core data. In small groups they prepare their graphs using colored pencils, and discuss the results.
Curated OER
Between The Extremes
Students analyze graphs for specific properties. In this algebra lesson, students solve equations and graph using the TI calculator. They find the different changes that occur in each graph,including maximum and minimum.


