Space Awareness
The Climate in Numbers and Graphs
Weather versus climate: weather relates to short time periods while climate averages the weather of a period of many years. Scholars learn about average temperature and precipitation in various climate zones and then apply statistics...
Exploratorium
Jacques Cousteau in Seashells
Visionaries create images out of dots to demonstrate the eye-brain connection. Through this activity, they learn that the brain interprets data collected by the eye into recognizable information. Search online for "Jacques Cousteau in...
Curated OER
7th Science Quiz
This seventh grade life science quiz has a professional appearance and well-written multiple-choice questions. However, it seems to cover too broad a variety of biology topics for only 15 questions to fully assess. There is one question...
Mascil Project
Epidemics: Modelling with Mathematics
The Black Death epidemic is responsible for more than one million deaths in the United Kingdom. An inquiry-based activity has young scholars explore the rate of disease spread. They then analyze graphs showing data from epidemics such as...
Science 4 Inquiry
Snakes in the Everglades
The Burmese python is on the loose ... and he's hungry! Illustrate the differences between causative and correlative relationships through an inquiry lesson. Pupils examine several sources of information to determine if there is a...
Curated OER
Solar Heating in the Himalayas
A fascinating lesson plan on how solar power is utilized by people who live in the Himalayas is here for you. In it, learners perform a case study which will help them understand that solar energy is a renewable resource, that geography...
InqueryPhysics
Interpreting Motion Graphs
Every movement in the world can be measured and even motionless objects can be significant indicators of movement. Focus on motion graphs that feature distance vs. time, speed vs. time, and positive and negative acceleration.
Curated OER
Interpreting Position vs. Time Graphs (Still Pretty Basic Stuff)
This is an interactive physics slide show that quizzes viewers about position versus time. It is set up as a series of 10 questions to answer: a graph with a questions slide followed by an answer slide. This is terrific practice in graph...
Teach Engineering
Air Pollution in the Pacific Northwest
Scholars investigate levels of nitrogen dioxide in the Pacific Northwest by examining the role of nitrogen in air pollution and how remote sensing can be used to measure nitrogen levels. An Excel spreadsheet calculates the difference...
Chymist
The Solubility of a Salt in Water at Various Temperatures
An educational activity allows young chemists to test the solubility of different types of salt at various temperatures. Groups create a graph using data from unsaturated, saturated, and supersaturated solutions.
Polar Trec
Global Snow Cover Changes
Snow is actually translucent, reflecting light off its surface which creates its white appearance. Pairs or individuals access the given website and answer questions about snow cover. They analyze graphs and charts, examine data, and...
National Security Agency
Line Graphs: Gone Graphing
Practice graphing and interpreting data on line graphs with 36 pages of math activities. With rationale, worksheets, and assessment suggestions, the resource is a great addition to any graphing unit.
Polar Trec
How Much Data is Enough?
The next time you read a magazine or watch the news, make note of how many graphs you see because they are everywhere! Here, scholars collect, enter, and graph data using computers. The graphs are then analyzed to aid in discussion of...
NASA
The Big Climate Change Experiment Lesson 3: Climate Change Lines of Evidence
Consider the preponderance of evidence when making a verdict. The third of five lessons in Unit 1: The Big Climate Change Experiment focuses on the evidence for climate change. Learners study graphs, diagrams, and pictures regarding...
Consortium for Ocean Leadership
Nannofossils Reveal Seafloor Spreading Truth
Spread the word about seafloor spreading! Junior geologists prove Albert Wegener right in an activity that combines data analysis and deep ocean exploration. Learners analyze and graph fossil sample data taken from sites along the...
Towson University
Looking Backwards, Looking Forward
How do scientists know what Earth's climate was like millions of years ago? Young environmental scholars discover how researchers used proxy data to determine the conditions present before written record. Grouped pupils gain experience...
Curated OER
Regents High School Examination: Living Environment 2009
Emerging ecologists need a full understanding of life, from the inner workings of a cell to the complex relationships among organisms. This examination is meant to assess high schoolers after an entire year course on the living...
Curated OER
Fish Communities in the Hudson
Learning to read data tables is an important skill. Use this resource for your third, fourth, or fifth graders. Learners will will study tables of fish collection data to draw conclusions. The data is based on fish environments in the...
Shodor Education Foundation
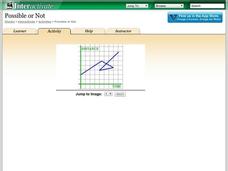
Possible or Not?
What does the graph mean? Pupils view 10 graphs and determine whether they are possible based on their contexts. The contexts are distance versus time and profit versus time.
BW Walch
Creating and Graphing Exponential Equations
Frequently found in biology and economic application problems, exponential equations show up as stars in this introductory presentation. Taking no background or knowledge of exponentials for granted, the slides walk learners...
Radford University
A Change in the Weather
Explore the power of mathematics through this two-week statistics unit. Pupils learn about several climate-related issues and complete surveys that communicate their perceptions. They graph both univariate and bivariate data and use...
Curated OER
Bycatch
Bycatch is the unwanted and discarded marine life caught during commercial fishing. Young marine scientists review bycatch litigation and analyze graphs of bycatch data and answer questions about it. This raises awareness while...
Curated OER
Ornithology and Real World Science
Double click that mouse because you just found an amazing lesson! This cross-curricular Ornithology lesson incorporates literature, writing, reading informational text, data collection, scientific inquiry, Internet research, art, and...
National Wildlife Federation
Wherefore Art Thou, Albedo?
In the sixth lesson in a series of 21, scholars use NASA data to graph and interpret albedo seasonally and over the course of multiple years. This allows learners to compare albedo trends to changes in sea ice with connections to the...


