Curated OER
Probabilities for Number Cubes
Middle schoolers explore the concept of probability. In this probability lesson, students roll a six-sided number cube and record the frequency of each outcome. Middle schoolers graph their data using a frequency chart and keep tally...
Raytheon
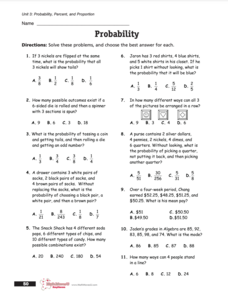
Probability, Percent, and Proportion
In this probability and predictions learning exercise, students read 1 page of facts, then solve 8 pages of problems related to probability, with answers keys included.
Curated OER
Teddy Bears Everywhere
Students explore the history of teddy bears. In this comprehension lesson, students bring a bear of their own to compare and contrast with their classmates. Students read book and discuss the events and draw pictures of the scenes.
August House
The Magic Pot
The Magic Pot by Patricia Coombs is the theme of this multidisciplinary lesson plan. Early readers first take part in a read aloud and grand conversation about the story's details. Then, they get to work practicing their skills in...
Curated OER
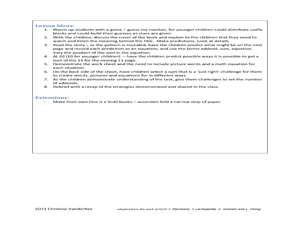
Book Title: One is a Snail, Ten is a Crab
Students read a story and write math problems. In this reading and math comprehension lesson, students preview and read the book "One is a Snail, Ten is a Crab". Students predict ways to get a sum of 11, write math equations and draw...
EngageNY
Comparing Estimated Probabilities to Probabilities Predicted by a Model
Small groups devise a plan to find the bag that contains the larger percentage of blue chips. they then institute their plans and compare results to the actual quantities in the bags.
Curated OER
Jellybean Graphs
Second graders predict and graph data based on the color of jelly beans they think are in a handful. In this prediction lesson plan, 2nd graders will predict how many of each color jellybean are in a handful. Then they graph these...
Curated OER
Heart to Heart
Students predict the outcome of a question and conduct a survey and record their findings on a bar graph.
National Council of Teachers of Mathematics
Is It Fair?
In this probability instructional activity, learners answer nine questions about the fairness of games. Students determine if a game is fair or not. They list outcomes and find ones' chances of winning.
Curated OER
Probability
Third graders conduct experiment, collect data, predict, record, and discuss outcomes, and analyze data for probability.
Curated OER
Probability
Fifth graders study probability of events. They predict outcomes, and participate in hands-on experiments to find the probability of specified events. Afterward, 5th graders write probability of events in fractions and decimals.
Curated OER
M & M Madness
M&M's are always a great manipulative to use when teaching math. In this graphing lesson plan, learners predict how many of each color of M & M's there are. They count up each color and plug the data into a graph using the...
Curated OER
Linear and Quadratic Model, Data Modeling
Students model quadratic and linear equations. In this algebra lesson, students solve word problems using equations. They create scatter plots and make predictions using correlations.
Virginia Department of Education
Growing Patterns and Sequences
Learners explore, discover, compare, and contrast arithmetic and geometric sequences in this collaborative, hands-on activity. They build and analyze growing patterns to distinguish which kind of sequence is represented by a set of data...
Utah Education Network (UEN)
Mathematics: Growing Patterns
Learners graph growing patterns using ordered pairs on a coordinate grid. They read The Fly on the Ceiling, a Math Myth.
Utah Education Network (UEN)
Geo Shapes
Invite your first graders to compose and decompose two and three-dimensional figures with this fun, hands-on instructional activity. They investigate and predict the results of putting together and taking apart two-dimensional shapes...
Curated OER
Data Analysis, Probability, and Discrete Mathematics: Lesson 4
Eighth graders investigate the concepts of probability while performing data analysis. They apply statistical methods in order to measure or predict some possible outcomes. The information is collected and graphed, 8th graders analyze...
Curated OER
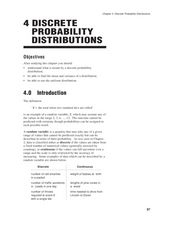
4 Discrete Probability Distributions
High schoolers read and complete problems on how to solve discrete probability distributions. In this probability distributions lesson plan, students read math problem examples and solve them.
Curated OER
Making Patterns - Create, Analyze, and Predict
Fourth graders practice making patterns using Unifix cubes and identify, analyze, and determine rules for describing numerical patterns involving operations and nonnumerical growing patterns. They also find an example of a pattern in...
Curated OER
Using Random Sampling to Draw Inferences
Emerging statisticians develop the ability to make inferences from sample data while also working on proportional relationships in general. Here, young learners examine samples for bias, and then use random samples to make inferences...
Curated OER
Height versus Shoe Size
Pupils find a correlation between a person's height and his/her shoe size. They have access to entering data into lists on a graphing calculator and can complete scatter plots. Students read and interpret a scatter plot and use the...
Curated OER
Finding Equations
Learners make equations from everyday data. They create a graph from the equations. Students predict and analyze the results. Learners complete the second scenario on their own and turn in their handout.
Curated OER
Berlioz the Bear
Young children read the story, Berlioz the Bear and complete various reading and writing activities. They learn about fiction and non-fiction, and complete graphing and writing activities for the story. Youngsters draw the bear and use...
Curated OER
Modeling Linear Relationships
Students graph lines using the slope and y-intercept. In this algebra lesson, students create data using tables and equations. They use their data to make predictions and draw conclusion.


