EngageNY
Modeling with Quadratic Functions (part 2)
How many points are needed to define a unique parabola? Individuals work with data to answer this question. Ultimately, they determine the quadratic model when given three points. The concept is applied to data from a dropped object,...
Curated OER
Sandia Aerial Tram
Your learners analyze a table of real-life data in order to write an equation that best models the information. Exponential, quadratic, and linear rates of changes are all possibilities in this task.
PBL Pathways
Medical Insurance
Design a plan for finding the best health insurance for your money. Learners compare two health plans by writing and graphing piecewise functions representing the plan rules. Using Excel software, they create a technical report...
Curated OER
Walk-A-Thon
Students graph linear http://www.lessonplanet.com/review?id=180542equations. In this problem solving lesson, students calculate slope and plot ordered pairs on a coordinate grid. Using a real-life example of a walk-a-thon, students...
Curated OER
Graphing Real World Situations
Students solve linear equations using graphs. In this algebra instructional activity, students depict real life situation using lines and functions. They identify the slope, data and predict graphing behavior.
Curated OER
Profitable Soda Stand
Am I making any money? Help learners determine if their fictitious soda stand is turning a profit. They graph linear equations using the slope and y-intercept and identify the best price to use to sell soda. They identify the domain and...
Newspaper Association of America
By the Numbers: Mathematical Connections in Newspapers for Middle-Grade Students
A cross-curricular resource teaches and reinforces mathematical concepts with several activities that use parts of a newspaper. Scholars use scavenger hunts to find the different ways math is used in the paper along with using data...
Curated OER
Baseball Relationships - Using Scatter Plots
Students use graphing calculators to create scatter plots of given baseball data. They also determine percentages and ratios, slope, y-intercepts, etc. all using baseball data and statistics.
Curated OER
Walking on Air
Students collect and analyze data with a graph. In this statistics lesson, students use central tendencies to find the meaning of their data. They display the data on a Ti calculator.
Curated OER
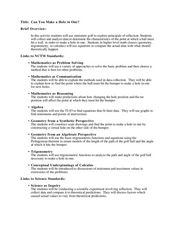
Can You Make a Hole in One?
Students relate miniature golf to reflection of an image. In this algebra activity, students collect and graph data as they study linear equations. They apply properties of graphing to solve real life scenarios.
Howard County Schools
Generous Aunt
Witness the power of exponential growth with an activity that investigates two different savings plans. Class members create tables of values to see how and when a savings plan increasing exponentially exceeds one increasing linearly.
Curated OER
FCAT Real World Solving Linear Equations/Systems
Pupils relate real life situation to the equations, graphs and inequalities. They model real life scenarios using matrices and draw conclusions from their data. This lesson plan is aligned with FCAT.
Charleston School District
Increasing, Decreasing, Max, and Min
Roller coaster cars traveling along a graph create quite a story! The lesson analyzes both linear and non-linear graphs. Learners determine the intervals that a graph is increasing and/or decreasing and to locate maximum and/or minimum...
Inside Mathematics
Vencent's Graphs
I like algebra, but graphing is where I draw the line! Worksheet includes three multiple-part questions on interpreting and drawing line graphs. It focuses on the abstract where neither axis has numbers written in, though both are...
Curated OER
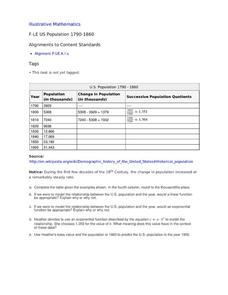
US Population 1790-1860
Your young population scientists analyze a table of values, write a model to represent the real life data, finish the table of data and predict future populations in a collaborative, real-life activity.
Curated OER
Measurement: Finding Areas of Rectangles
Gardening geometers construct the formula for the area of a rectangle by viewing a video revolving around two young people, their lawn mowing business, and their need to charge by the square meter. A relevant real-life application activity!
Curated OER
Move It
Studens collect and graph data. In this algebra lesson, young scholars use a CBL and CBR with a TI Calcualtor to observe linear graphs. They use the correct vocabualry as they discuss the collected data.
Curated OER
Scatterplots and Regressions
In this scatterplots and regressions activity, students solve 6 different types of problems related to graphing scatterplots and interpreting regressions. First, they create a scatterplot from the given data coordinates and then,...
Virginia Department of Education
Logarithmic Modeling
Explore logarithms and logarithmic regression. Young mathematicians first learn about inverse functions and about the logarithm function family. They take their newfound knowledge to use logarithmic functions to model situations and...
101 Questions
Bottomless Mug
How much coffee can you actually drink? An intriguing lesson has learners consider an advertisement for a bottomless mug of coffee. While considering the price of the mug, they analyze different scenarios to determine the cost-saving...
Texas Instruments
Is It or Isn't It Proportional
How can you tell if number relationships are proportional? Mathematicians investigate proportional relationships. They compare and contrast functions and graphs to determine the characteristics of proportional relationships, as well as...
Curated OER
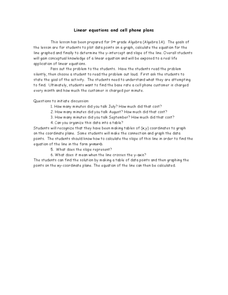
Linear Equations and Cell Phone Plans
Young scholars calculate the amount of minutes they get charged for each month. In this algebra lesson, students relate linear equations to talking on the phone and the cost to do so. They create graph to plot the cost and usage of the...
Virginia Department of Education
Road Trip
Help plan a road trip with linear equations. Scholars consider two different rental car companies and write equations representing the cost for each company. They graph the system of equations to determine the conditions under which each...
Curated OER
Slopey Math
Students identify the slope of a line and use it to solve real life problems. In this algebra lesson, students write linear equations in slope intercept form and make a correlation to its relation to the real world. They use the slope an...


