Houston Area Calculus Teachers
Area and Volume
An AP calculus lesson begins with an activity to determine the volume of a solid using a cross-section. Next, learners review the ways to find the area between two curves , as well how to find the volume of a solid created from the...
Curated OER
Graphing Data from the Chemistry Laboratory
Learners graph and analyze data using a spreadsheet.
Curated OER
The Big Bang-Hubble's Law
For this Hubble's law worksheet, students use data for galaxies which include their distance and speed. Students make a graph to show the distance to each galaxy and the speed of each galaxy. They use their graph to answer 4 questions...
Curated OER
Activity One Teacher Page: Vehicles In Motion
Students identify variables that affect the system, and specify which variables are independent and which are dependent.
Curated OER
Who's got the fastest legs?
Students use a stopwatch to collect information for a scatterplot. In this fastest legs lessons, students collect data through the taking of measurements, create and find a median number. Students develop an equation and answer...
Curated OER
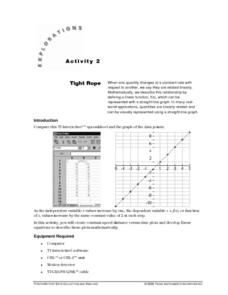
Tight Rope
Learn how to explore the concept of linear functions. In this linear functions lesson, students collect linear data from a motion detector. Students walk to create a linear function. Students plot the points on a graph and determine a...
Curated OER
Seeing is Believing: Derivatives
Learn to solve functions by taking the derivatives. In this calculus lesson, students compare the graph of a derivative to that of the original function.
Curated OER
Rational Numbers
Young scholars investigate rational numbers in this algebra lesson. They graph systems of equations and use technology to find the point of intersection. They need a TI for this assignment.
Curated OER
Applying Trigonometric Functions To Real Life
Students examine where trigonometry exists outside the classroom. In this trigonometry lesson plan, students create trigonometric functions to match the data provided and to solve word problems relating to the real world.
Curated OER
Strike a Pose: Modeling in the Real World (There's Nothing to It!)
Adjust this lesson to fit either beginning or more advanced learners. Build a scatter plot, determine appropriate model (linear, quadratic, exponential), and then extend to evaluate the model with residuals. This problem uses real-world...
Curated OER
M&M Exponential Activity
Students create a scatter plot of their experimental data. In this algebra lesson, students use M&M's to determine an algebraic model. They discuss results in class.
Curated OER
Modeling Population Growth
Students investigate the reasons for taking a census and determine the problems that are involved in the process. They examine the population figure for Montana and Lake county before using the information to complete the included...
Curated OER
Conductivity of salt Solutions
Students investigate the concentration level of solutions. In this math/science lesson, students identify three different ionic compounds. They predict the conductivity of each using their collected data.
Curated OER
Price of Apples- Linear Data
Pupils collect data and create a graph. In this algebra lesson plan, students describe functions graphically, algebraically and verbally. They identify functions as being independent and dependent using variables.
Curated OER
Relating Distance and Velocity Over Time
Students calculate the distance and velocity over time. In this algebra lesson, students graph a linear function to represent the distance vers time travel. They interpret their graphs and draw conclusion.
Curated OER
Risky Business
Students view a video on AIDS, HIV and the ways in which HIV is spread. They discuss ways to avoid contracting HIV and participate in a simulation that shows the growth of a communicable disease.
Curated OER
Understanding Abuse
High schoolers are introduced to the various forms of child abuse. Using the internet, they discover the proper ways to report abuse to adults and the warning signs of someone being abused. In groups, they complete a case study to end...
Curated OER
The Closer I Get To You
Pupils explore the law of reflection. Through experimentation and problem solving, they collect and analyze data pertaining to reflection. The data is plotted on a graph and formulas for calculating the x and y values are evaluated.
Curated OER
Topic 2: Graphing 2-Variable Linear Equations
Young scholars explore the concept of 2-variable equations and expressions. In this 2-variable equation and expression lesson, students translate 2-variable word problems into 2-variable equations and expressions.
Curated OER
Using A Volunteer Acquired Database Constructed On The Internet, Examine the Relationship between Dissolved Oxygen and Water Temperature
Ninth graders access a database and open a spreadsheet. In this oxygen and water temperature lesson plan students save the database, sort it and generate scatter plot graphs.
Curated OER
Who Does the Lottery Benefit?
Students investigate the pros and cons of the lottery. In this algebra activity, students use the formulas for permutation and combination to test their arguments about the lottery. They collect data about their argument and plot it on a...
Curated OER
Linking Real World Data to the Classroom
Students analyze data representing real life scenarios.In this algebra lesson plan, students collect, plot and analyze data using a graph. They use different methods to represent and present their data.
Curated OER
A Functional Housing Market
Learners access the Internet to search for housing prices in Houston, Texas,(the location can be changed to accommodate any location) and compare the prices to the number of square feet found in the living area of a house.
Curated OER
Lesson Plan On Fran Data
Seventh graders investigate the concept of functions and how they are used in the context of the real world while identifying the dependent and independent variables. They graph relations and functions and find the zeros of functions....


