Curated OER
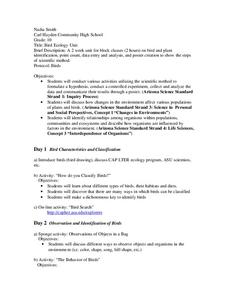
Bird Ecology Unit
Tenth graders conduct various activities utilizing the scientific method to formulate a hypothesis, conduct a controlled experiment, collect and analyze the data and communicate their results through a poster. They also identify...
Illustrative Mathematics
Chicken and Steak, Variation 2
Many organizations put on barbecues in order to make money. In a real-world math problem, the money allotted to purchase steak and chicken at this barbecue is only one hundred dollars. It is up to your potential chefs to figure out how...
Curated OER
Developing Environmental Awareness Through Problem Solving
Students examine the relationships among living and non-living parts of the environment. Using their senses, they identify the objects in their classroom. In groups, they participate in experiments to discover where electricity comes...
Ohio Department of Education
I Can Name that Angle in One Measure! - Grade Eight
Collaborative groups work with geometry manipulatives to investigate conjectures about angles. They create a graphic organizer to use in summarizing relationships among angles in intersecting, perpendicular and parallel lines cut by a...
Rice University
Algebra and Trigonometry
Move on into trigonometry. An informative eBook takes the content of a College Algebra course and adds more relating to trigonometry and trigonometric functions. The content organization allows pupils to build upon their learning by...
EngageNY
Secant and the Co-Functions
Turn your class upside down as they explore the reciprocal functions. Scholars use the unit circle to develop the definition of the secant and cosecant functions. They analyze the domain, range, and end behavior of each function.
Virginia Department of Education
Quadrilateral Sort
If only you had a Sorting Hat to sort out quadrilaterals. Learners sort cutouts of quadrilaterals based on their properties and attributes. A flowchart helps them organize the results of the activity.
Virginia Department of Education
Rational Speed Matching
Ready, set, go! Individuals practice converting rational numbers between fractions, decimals, and percents. A speed game has teams match the three forms of rational numbers on a number line.
Curated OER
Clean Water vs. Dirty Water
Students study the importance of clean water to the survival of organisms and what activiities and material pollute water. They measure the temperature of water samples and create a class graph.
Curated OER
Introduction to Graphical Representation of Data Sets in Connection to Cellular Growth
Students practice graphing relationships between variables by studying topics such as exponential growth and decay. They conduct a series of numerical experiments using a computer model and a variety of physical experiments using mold,...
Curated OER
Lesson Plan for Fontana Mines
Students estimate and compute with rational numbers. They compare, order and convert among fractions, decimals and percents. Students analyze problems to determine if there is sufficient or extraneous data to solve.
Curated OER
It's All in the Measurements
Study customary measurements with your sixth graders. They will investigate linear and capacity measurements to then measure and convert linear and capacity units. Finally they will work in small groups to conduct experiments. Resources...
Curated OER
Benefits of Indoor Plants
Learners diagram a plant. In this Science lesson, students explore the concept of photosynthesis focusing on the oxygen production. Learners calculate the amount of plants needed to filter the air in their classroom.
Curated OER
Student Costs Data Table
Students compare and contrast two routes selected for a virtual field trip. They create a data table of educational activities, lodging, and meal costs using Microsoft Excel software.
Curated OER
Virtual Field Trip
This hands-on resource has future trip planners analyze graphs of mileage, gasoline costs, and travel time on different routes. While this was originally designed for a problem-solving exercise using a Michigan map, it could be used as a...
Curated OER
Choose The Appropriate Graph
Fifth graders work in groups to investigate the proper use of a graph during a schoolyard ecology project. The challenge of the project is for students to choose the proper form of a graph. They gather data and conduct analysis with the...
Curated OER
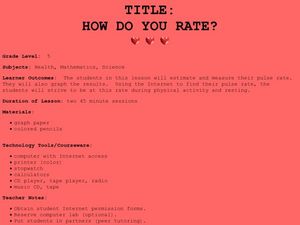
How Do You Rate?
Fifth graders make a graph. In this pulse rate lesson, 5th graders estimate their pulse and record it. Students measure their pulse while at rest and after physical activity and record it. Students use the internet to graph their results...
Curated OER
Michigan Virtual Field Trip
Students analyze data from a virtual field trip to Michigan. They conduct Internet research on mileage and travel time between cities, calculate and compare fuel costs, and research and calculate lodging, activities, and meal costs.
Curated OER
Sizing Up the Supersize Croc
Students examine and compare traits of humans and crocodiles. In this crocodile lesson students use a ratio to estimate the height of a person and compare that to a crocodile.
Curated OER
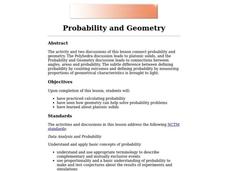
Probability and Geometry
Students explore the ways Geometry can help solve probability problems. Students describe platonic solids and practice calculating probability using an online resource. They construct dice with various numbers of sides to demonstrate...
Curated OER
Carrying Capacity of Ecosystems
Students define population and carrying. In this algebra lesson, students explore exponential growth and decay based on animals and things that grow or decrease exponentially. They graph their findings and discuss their results as they...
Curated OER
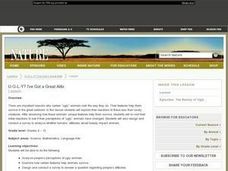
U-G-L-Y? I've Got a Great Alibi
Students create a survey to explore people's perception of beauty. In this biology instructional activity, students explain how an animal's appearance helps it survive. They analyze survey results and present findings in class.
Curated OER
How Does Your Garden Grow?
Students create a design for a school garden. In this garden design lesson plan, students analyze what plants grow best in their school's climate and work in teams to design a garden. Students measure the existing space, determine the...
Curated OER
The Quadratic Formula
Students solve quadratic function by completing the square. In this algebra lesson plan, students use the quadratic formula to factor quadratics and find the roots. They graph the parabola and identify its properties.


