CK-12 Foundation
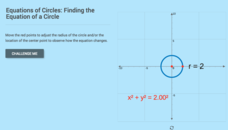
Equations of Circles: Finding the Equation of a Circle
It's all about location and size. With the aid of the interactive, pupils explore the relationship between the location and size of a circle and its equation. The learners use that relationship to determine the equation of a circle given...
PBL Pathways
Cell Phones
Calling all subscribers! Model revenue based on individual cell phone subscribers. The project-based learning activity presents a challenge to scholars from a cell phone company. Individuals model data provided to them from the company...
Curated OER
Use a Bar Graph
In this bar graph worksheet, learners use a given bar graph to answer a set of 3 questions. Answers included on page 2.A reference web site is given for additional activities.
Curated OER
Creating Line Graphs
Learners relate data to coordinate graphs and plot points on this graph. They use minimum wage data to construct the graph. Students decide appropriate time intervals for the graphs. They share graphs with their classmates.
Curated OER
Seized Before Flights: Graph
In this bar graph worksheet, students analyze a graph that show the number of prohibited items intercepted at U.S. airport screening checkpoints. Students answer 3 problem solving questions about the data on the graph.
Curated OER
Statistics of Mars
Students explore the concept of central tendencies. In this central tendencies lesson, students sort M&M's or Skittles based on color. Students graph their results. Students find the mean, median, and mode of their data.
EngageNY
Modeling a Context from Data (part 2)
Forgive me, I regress. Building upon previous modeling activities, the class examines models using the regression function on a graphing calculator. They use the modeling process to interpret the context and to make predictions based...
Inside Mathematics
Swimming Pool
Swimming is more fun with quantities. The short assessment task encompasses finding the volume of a trapezoidal prism using an understanding of quantities. Individuals make a connection to the rate of which the pool is filled with a...
CK-12 Foundation
Vertical Line Test: Exploration
What do vertical lines have to do with functions? Individuals slide a vertical line through four different graphs. They use that vertical line test to determine if the graphs represent functions.
Achieve
Ground Beef
Ever wonder how a butcher creates the different types of ground beef? Young mathematicians explore the methods butchers use to create their desired ground beef quality. Given a combination of two types of meat with varying leanness,...
CK-12 Foundation
Linear Inequalities in Two Variables
Take the tediousness out of finding solutions of inequalities by graphing. Individuals use an interactive that allows them to adjust a system of inequalities on a coordinate plane. Using the interactive helps find solutions to systems of...
CK-12 Foundation
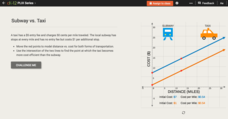
Problem-Solving Models: Subway vs. Taxi
Ride to success in understanding systems of equations. Scholars graph a system of equations on the cost of a subway and a taxi using an interactive. Using this graph allows users to answer some questions about the situation.
Achieve
Ivy Smith Grows Up
Babies grow at an incredible rate! Demonstrate how to model growth using a linear function. Learners build the function from two data points, and then use the function to make predictions.
Achieve
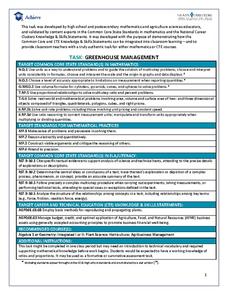
Greenhouse Management
Who knew running a greenhouse required so much math? Amaze future mathematicians and farmers with the amount of unit conversions, ratio and proportional reasoning, and geometric applications involved by having them complete the...
CK-12 Foundation
Standard Form of Linear Equations: Seesaw
Don't hem and haw, learn about equations using a seesaw. An easy-to-use interactive has pupils move a seesaw on a coordinate plane to investigate the standard form of a linear equation. By completing a set of challenge questions, they...
CK-12 Foundation
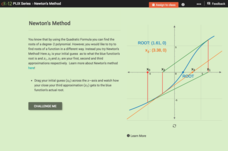
Newton's Method
Does the accuracy of the first guess make a difference down the line? Learners investigate the effects of the iterative process of finding roots, using Newton's Method. By moving the initial guess of a root on a graph, pupils observe the...
American Statistical Association
EllipSeeIt: Visualizing Strength and Direction of Correlation
Seeing is believing. Given several bivariate data sets, learners make scatter plots using the online SeeIt program to visualize the correlation. To get a more complete picture of the topic, they research their own data set and perform an...
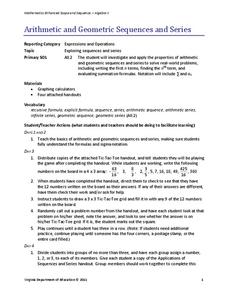
Virginia Department of Education
Arithmetic and Geometric Sequences and Series
Examine the importance of sequence and series through contextual situations. Here, learners partake in a five-day unit that begins with the basics of arithmetic and geometric sequences and series. As it progresses, pupils apply the...
Curated OER
Exploring Quadratic Graphs
Young scholars solve quadratic equations using graphs. In this algebra lesson plan, students factor quadratic equations and graph their answer. They discuss the shape of their graph based on the function.
Curated OER
Using Negative Numbers
Fourth graders explore negative numbers with this resource. They discuss positive and negative numbers by counting who is present and absent, placing numbers on a number line, and graphing temperatures. Using a variety of activities,...
CK-12 Foundation
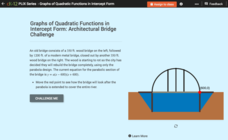
Graphs of Quadratic Functions in Intercept Form: Architectural Bridge Challenge
There are architectural parabolas all around us! A creative lesson analyzes the architecture of a parabolic bridge. Learners must manipulate the bridge to satisfy given criteria and then answer questions about the dimensions of the...
Curated OER
Agriculture and the Government
Students study the government's involvement in the U.S. A's food production and make connections relating to farm programs. In this historical agriculture lesson, students read content and research significant information. Students then...
Curated OER
Analyze This
Students gain practice in the analysis of various types of graphs common in daily life. These examples often use graphic images like charts, graphs, tables, and pictures to supplement learning.
Curated OER
Scientific Graphs
Students organize data collected from their experiments using graphs. In this statistics and biology lesson, students organize their scientific data from an article into readable graphs. They define the usefulness of their graph and...


