Curated OER
Great Graphing
Young scholars collect data, use a computer spreadsheet program to create various graphs, and compare the graphs. They state the findings of each graph in writing and decide which graph type best represents the data.
Curated OER
Rainforest Data
For this geography worksheet, learners use the climate data given to create a temperature line graph and rainfall bar graph for each of three locations given. Then they use an atlas to compare their graphs and draw conclusions about the...
Curated OER
Gathering, Recording, and Presenting Data
Sixth graders use the local newspaper to find and discuss examples of uses of statistics and the ways in which the information is presented. They create and represent their own set of data showing how students get to school each day.
Curated OER
Algebra: Sorting, Representing, and Patterns
Students sort objects and create patterns. In this sorting and graphing lesson plan, students work at centers to find a way to sort a group of objects, then make a graphical representation of the number of each item. Finally, students...
Curated OER
The Write Stuff
Fourth graders share a previously written portfolio piece and the class guesses the genre. Students use tally marks to keep track of how many of each piece there are in class. Once the data collection is complete, 4th graders create a...
Curated OER
Misleading Graphs
Students explore number relationships by participating in a data collection activity. In this statistics lesson, students participate in a role-play activitiy in which they own a scrap material storefront that must replenish its...
Curated OER
Designing a Study
Students explore features to consider when designing a scientific study. In this science research lesson plan, students examine different methods of data collection and consider which method would be appropriate for determining how many...
Pennsylvania Department of Education
Freckle Face
Students collect and record data. In this early data analysis lesson, students gather data about their partners face. As a class, the students use tally marks and pictographs to record the data and answer question about the information...
Curated OER
Experiment Report (Normal Form)
Here is a handy handout to give any science class as a guide to writing lab reports. It is a blank outline that you can have aspiring scientists fill out when they experiment, or imitate as they record their experiments in a lab journal....
Curated OER
Gummy Bear Picture Graph
First graders investigate picture graphs. In this graphing lesson, 1st graders create a picture graph with the x-axis being number and the y-axis being color. Students sort their gummy bears by color and use pictures of colored bears...
Curated OER
Cyber Chow Combos
Young scholars, after watching the CYBERCHASE episode, "A Day at the Spa,"represent and count combinations of choices using tree diagrams.
K12 Reader
Showing Data on a Graph
Here's a learning exercise that not only introduces kids to graphing, but also is designed as a reading comprehension activity. After reading the article about graphing, kids respond to a series of questions based on the article.
National Security Agency
Going Green with Graphs
In this unit designed for second graders, youngsters are introduced to conducting surveys and creating tally charts based on the data they gather. Students then construct bar graphs, and observe the relationships between the two...
Corbett Maths
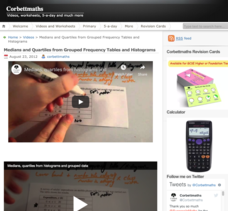
Medians and Quartiles from Grouped Frequency Tables and Histograms
Determine medians within a group. Given data represented as a frequency table of grouped data, the video demonstrates finding an estimation for the median. After finding the group where the median resides, the presenter uses a formula to...
Curated OER
Voter Turnout
Explore politics by analyzing the voting process. Pupils discuss the purpose of casting votes in an election, then examine graphs based on the data from a previously held election's turnout. The activity concludes as they answer study...
Balanced Assessment
Presidential Popularity
Media often misrepresent data and statistics to their advantage. This lesson asks scholars to analyze an article with misleading statistics. They use margin of error and mean data in their studies. Once they complete their analysis,...
Virginia Department of Education
Determining Absolute Age
How can radioactive decay help date old objects? Learners explore half-life and radioactive decay by conducting an experiment using pennies to represent atoms. Young scientists graph data from the experiment to identify radioactive decay...
BioEd Online
Good Stress for Your Body
Stress the importance of the different types of pressure our mind and body experience in a lesson about how certain types of stress are actually necessary and good for our bodies. As astronauts and people with injuries can attest, not...
Scholastic
Study Jams! Pictograph
An easy and fun way to look at data is with a pictograph. A lesson plan friendly enough for multiple grade levels shows how to set up this graph with a corresponding key. The steps review the importance of choosing an appropriate...
NASA
Future Temperature Projections
No one knows what the future will bring, but it's likely to be warmer than before. Pupils first learn about the NASA GISS ModelE2, a global climate model, and about representative concentration pathways that estimate the global output of...
Balanced Assessment
Books from Andonov
To examine mathematical functions in a modeling situation pupils combine quadratic and step functions to represent a presented scenario. They both graph and write a function to represent data shown in a table.
Curated OER
Statistics for Graphing
Students use the Internet to access a variety of websites that present statistics and information for use in graphing. They represent sports statistics, geographical measurements, temperatures and more.
Curated OER
Descriptive Statistics
Students demonstrate how to use frequency and scatter diagrams. In this statistics lesson, students are introduced to different techniques of representing data. Students sort and graph data on a worksheet and use a frequency diagram to...
Curated OER
Mapping River Statistics
Students research different statistics to do with the Mississippi River. They answer questions about finding data and collect it by conducting research. The research is used to construct a data table. Then students use the table to...


