Curated OER
Changing Planet: Sea Levels Rising
Begin by showing a six-minute video, Changing Planet: Rising Sea Level as an anticipatory set. Pupils draw a topographic map of a potato continent. Finally, they will visit NOAA's sea levels online map and NASA's carbon dioxide...
Illustrative Mathematics
Average Cost
Here is an activity that presents a good example of a function modeling a relationship between two quantities. John is making DVDs of his friend's favorite shows and needs to know how much to charge his friend to cover the cost of making...
Mathematics Vision Project
Quadratic Functions
Inquiry-based learning and investigations form the basis of a deep understanding of quadratic functions in a very thorough unit plan. Learners develop recursive and closed methods for representing real-life situations,...
Curated OER
Education for Global Peace
Fifth graders construct data graphs based upon sets of data. In this graphing lesson, 5th graders read the text If the World Were a Village and discuss how types of graphs accurately represent a large population. Students construct their...
Curated OER
Live, From New York
In this data analysis worksheet, students study the information on a data table about the hosts of Saturday Night Live. Students answer 8 problem solving questions about the table.
Curated OER
National Longitudinal Survey of Children and Youth (NLSCY)
Students review data analysis techniques. In this statistics lesson, students access statistical software regarding the National Longitudinal Survey of Children and Youth. Students read and interpret the data as they complete the...
Curated OER
Jellybean Graphs
Second graders predict and graph data based on the color of jelly beans they think are in a handful. In this prediction lesson plan, 2nd graders will predict how many of each color jellybean are in a handful. Then they graph these...
Curated OER
Deciding Which Type of Graph is Appropriate
In this graphing worksheet, students read about line, bar, and pie graphs and then determine which graph is the best way to express data results. This worksheet has 3 short answer questions.
Curated OER
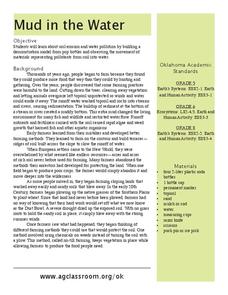
Mud in the Water
Sixth graders investigate erosion. In this erosion lesson, 6th graders explore how farming changes the environment. Students construct an erosion model and research ways to protect the soil from excess mud generated by farming.
Curated OER
Science and Technology
Students research inventions that have been created. In this historical technology lesson, students read the Harcourt Brace social studies textbook and discuss how inventors used graphs to display data. Students create a table to write...
Curated OER
Choose an Appropriate Graph
In this graphs worksheet, learners solve 6 fill in the blank problems where they choose the most appropriate type of graph for each set of data and explain why they chose that type. Students use bar graphs, histograms and circle graphs....
Curated OER
Modeling Earthquake Data
Learners evalute evolutionary theories and processe of Geology. They examine evidence that the movement of continents has had signicicant global impact, major geological events. Students evaluate the forces which shape the lithosphere...
Curated OER
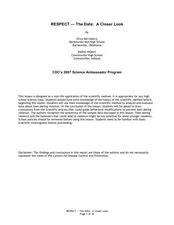
Respect--The Data: A Closer Look
Students explore the steps in the scientific method process. In this science lesson, students identify warning signs that someone is in an abusive dating relationship. They evaluate the credibility of information sources.
Curated OER
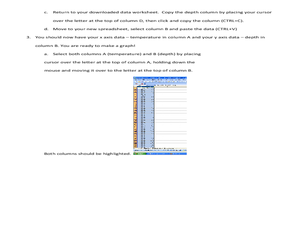
What's A Water Column Profile?
Students investigate water column data. In this earth science and seawater lesson, students determine how temperature, salinity, and density have an impact on sea water by viewing and analyzing data obtained from a number of websites....
Curated OER
From Data to Drinks - My Marketing Plan
Students research and discuss how Canada's aging population affects advertising. They record information from the 2001 census and create a marketing plan to sell a soft drink.
Curated OER
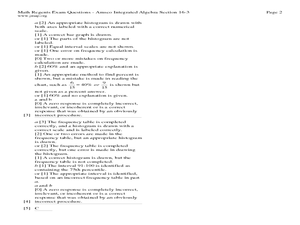
The Histogram
In this Algebra I/Algebra II instructional activity, learners construct and analyze histograms to develop a visual impression of the distributions of data. The two page instructional activity contains five problems. Answer...
Curated OER
Is This Really Okay for Me? A Public Health Statistical Analysis
Future public health consultants are asked in a letter to help determine if a fictitious drug is causing birth defects in a population. They perform a simulation using beans and probability calculations to come to a conclusion. Note that...
Curated OER
Gingerbread Man Math
Students collect and explore gingerbread man data. In this math and technology lesson plan, students examine how to organize and interpret data in three formats: objects, pictures, and graphs.
Curated OER
Baseball Math
Students collect data on baseball plays. In this statistics lesson, students graph their data and make predictions based on their observation. They calculate what the probability is that a favorable outcome would happen.
Curated OER
Atlatl Lessons for Grade 4
Fourth graders explore the weapons of the Aboriginal people. In this fourth grade math lesson, 4th graders create charts, tables, or diagrams to represent patterns and relations. Students investigate which dart length has the...
Curated OER
How Many More on a Graph?
First graders examine data on a graph and determine which variable on the graph has more. They draw pictures of their family members and determine which families have more members than other families. Using squares of paper to depict...
Curated OER
Line and Double Line Graphs: Reteach
In this graphing worksheet, students review the five steps for making a double line graph to display data. Students then use the graph they made following the shapes to answer the three questions.
Curated OER
Taking Poll Information
Learners investigate the election and poll surveys. In this statistics lesson plan, students take poll information and analyze the data. They graph their data and make predictions and conjectures.
Curated OER
Testing the Water
Pupils develop and test a hypotheses through collecting and recording water quality data. They perform their tests outdoors in a location with a safe stream and easy access for students. Their various experiments involve the entire...


