Illustrative Mathematics
Weather Graph Data
Teaching young mathematicians about collecting and analyzing data allows for a variety of fun and engaging activities. Here, children observe the weather every day for a month, recording their observations in the form of a bar graph....
NASA
Data Literacy Cube: Global Atmospheric Temperature Anomaly Data
Evaluate global temperature anomalies using real-world data from NASA! Climatologists analyze a data set using a literacy cube and differentiated question sheets. Team members evaluate global temperature anomaly data with basic...
Earth Watch Institute
Entering Local Groundhog Data in an Excel Spreadsheet
Here is a cross-curricular ecology and technology activity; your learners create spreadsheets depicting the location and number of groundhog dens in a local park. They research groundhogs and analyze data about where the groundhog...
Chicago Botanic Garden
Historical Climate Cycles
What better way to make predictions about future weather and climate patterns than with actual climate data from the past? Young climatologists analyze data from 400,000 to 10,000 years ago to determine if climate has changed over...
Curated OER
Graphing and Analyzing Biome Data
Students explore biome data. In this world geography and weather data analysis lesson, students record data about weather conditions in North Carolina, Las Vegas, and Brazil. Students convert Fahrenheit degrees to Celsius degrees and use...
Consortium for Ocean Leadership
Nannofossils Reveal Seafloor Spreading Truth
Spread the word about seafloor spreading! Junior geologists prove Albert Wegener right in an activity that combines data analysis and deep ocean exploration. Learners analyze and graph fossil sample data taken from sites along the...
Polar Trec
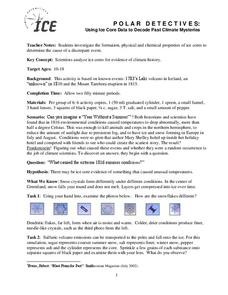
Polar Detectives: Using Ice Core Data to Decode Past Climate Mysteries
How does examining an ice core tell us about weather? Learners set up and explore fake ice cores made of sugar, salt, and ash to represent historical snowfall and volcanic eruptions. From their setups, scholars determine what caused the...
National Wildlife Federation
Wherefore Art Thou, Albedo?
In the sixth lesson in a series of 21, scholars use NASA data to graph and interpret albedo seasonally and over the course of multiple years. This allows learners to compare albedo trends to changes in sea ice with connections to the...
ARKive
Handling Data: African Animal Maths
Handling and processing data is a big part of what real scientists do. Provide a way for your learners to explore graphs and data related to the animals that live on the African savannah. They begin their analysis by discussing what they...
Curated OER
Ornithology and Real World Science
Double click that mouse because you just found an amazing lesson plan! This cross-curricular Ornithology lesson plan incorporates literature, writing, reading informational text, data collection, scientific inquiry, Internet research,...
Curated OER
Go Fish
Help learners discover methods to estimate animal population. They will participate in a simulation of catching and tagging fish in order to estimate the fish population. They scoop and count goldfish crackers, record data, and use...
Kenan Fellows
Climate Change Impacts
Turn up the heat! Young mathematicians develop models to represent different climates and collect temperature data. They analyze the data with regression and residual applications. Using that information, they make conclusions about...
Chicago Botanic Garden
Climate Change Around the World
You know climate change is happening when you see a bee take off its yellow jacket. Part four in a series of five lessons explores all factors affecting climate change: temperature, cloud cover, precipitation, and carbon dioxide. By...
Curated OER
Data Handling Techniques
Young scholars study data analysis methods. In this data analysis lesson, students study data compression and data editing methods used for the spacecraft Galileo. Young scholars study the 'lossless' and 'lossy' techniques.
Curated OER
Creating a Thematic Map
Students create and analyze a weather-related data table and a thematic map based upon information provided.
Curated OER
Fire Wars
Your class can practice collecting and analyzing data. They extrapolate information and derive data from fire season statistics. They also choose the most appropriate format to display collected data.
Curated OER
Beans and Baleen
Predict whale populations using different beans as whales! Learners observe different types of beans in a dish knowing that each bean represents a different kind of whale. They then predict how many "whales" there are in a certain area....
Berkshire Museum
Camouflage!: Collecting Data and Concealing Color
Help young scholars see the important role camouflage plays in the survival of animals with a fun science lesson. Starting with an outdoor activity, children take on the role of hungry birds as they search for worms represented by...
Curated OER
Choose The Appropriate Graph
Fifth graders work in groups to investigate the proper use of a graph during a schoolyard ecology project. The challenge of the project is for students to choose the proper form of a graph. They gather data and conduct analysis with the...
Curated OER
Examine the Data
Seventh graders examine a teacher-created database and identify specific variables and develop hypothesis statements as to their possible effect. They create a summary statement either proving or disproving their hypothesis.
Howard Hughes Medical Institute
Coral Reefs in Hot Water
Global warming is leaving coral reefs in hot water. What does that mean for their survival? Find out as scholars use authentic satellite data to explore the issue. Learners look for global trends in the data and research the effects the...
Curated OER
Learning to Make Line Graphs
Students analyze data and create a line graph. In this graphing lesson, students explore data from a previous experiment and plot the information on a line graph. Students analyze their findings.
Curated OER
Learning to Make Data Tables
Learners construct data tables using the results of previous experiments. In this graphing activity, students plot data and interpret the results. Learners discuss how they organized their data.
Curated OER
Random Sampling
In this random sampling worksheet, students compare data collected by a random sample to data collected by an actual count using pieces of paper with numbers written on them. They compare their data for the actual count to the random...


