Curated OER
Salinity
Learners define and discuss salinity, conduct classroom experiment to determine salinity of water sample by using hydrometer, record predictions, and demonstrate understanding of how salinity influences object's ability to float in water.
Curated OER
Salinity in Mill Creek
Fifth graders use water samples collected at three different locations of Utah's Mill Creek to test salinity of water, hypothesize about salinity levels at each location, record results, and discuss their findings with classmates. ...
Curated OER
Is the Hudson River Too Salty to Drink?
In this estuary worksheet, students examine data about the salinity of the Hudson River, create a graph from given data and complete 12 short answer questions about the data and graph.
Curated OER
Is the Hudson River Too Salty to Drink?
Students explore reasons for varied salinity in bodies of water. In this geographical inquiry lesson, students use a variety of visual and written information including maps, data tables, and graphs, to form a hypothesis as to why the...
Curated OER
Sink or Float?
Students analyze the relationship between density, buoyancy, and salinity. In this chemical properties lesson, students read a background activity for the lesson and experiments to the topics. Students discuss the questions and complete...
Curated OER
Cytoplasmic Streaming
Students prepare successful wet mount slide of Elodea. They determine and identify environmental conditions that induce cytoplasmic streaming. They determine the positive aspects of cytoplasmic streaming. They illustrate knowledge and...
Curated OER
One World Ocean
Students compare and contrast the properties of salt water in the oceans/seas and freshwater elsewhere on the planet. They also analyze mixing caused by currents in the ocean, including the effects of warm and cold water as well as with...
Curated OER
Water Quality Monitoring
Learners comprehend the four parameters of water quality. They perform tests for salinity, dissolved oxygen, pH and clarity or turbidity. Students comprehend why scientists and environmental managers monitor water uality and aquatic...
Curated OER
Understanding Salinity
Students discuss why the ocean is salty. They discuss what salinity is. Students are told that is they want to know how much salt is in a body or water, they would use a special scientific tool. They complete an Estuarine Layers science...
Curated OER
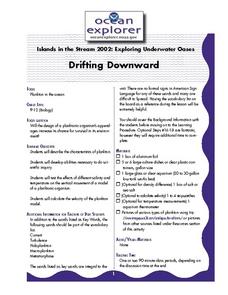
Drifting Downward
Students study the effects of different salients and temperatures on vertical movement of an organism. In this experimental instructional activity students design different shapes of foil to simulate drifting planktonic organisms.
Curated OER
Ocean Currents
For this ocean currents worksheet, students will use maps of the Atlantic Ocean currents and the Pacific Ocean currents to complete 6 short answer questions.
Curated OER
What is an Estuary?
Students define the terms estuary and watershed. They conduct an experiment to determine the density differences between fresh and saltwater. They examine the salinity distribution of the Peconic Bay Estuary.
Curated OER
Water Quality
Students examine the YSI and the water properties that it measures. They identify the different properties of water pH, DO, temperature, turbidity, and salinity and determine why it is important for them to test these parameters.
Curated OER
Upwelling - Cold One Day, Warm Another?
Discuss with your oceanographers what forces cause nearshore upwelling and downwelling. Display a line of wind vectors alongside a graph of the temperatures so that they can discover whether or not they are related. Discussion questions...
Curated OER
Freshwater Habitats
Young scholars take samples from local freshwater sources and examine them for macroinvertebrate life. They take samples from both shallow and deep freshwater environments, measure temperatures, and classify organisms found in their...
Curated OER
Aquatic Organisms and Their Habitats
Students investigate the presence of specific organisms in a freshwater habitat to determine the quality of that habitat. They conduct a field study and distinguish and classify organisms found during the field study.
Curated OER
To Drink or not to Drink
Seventh graders discuss water quality, water availability and water resources and how water is used in the world around them. They view a video on water quality then test for pH, temperature and dissolved oxygen to indicate water quality.
Curated OER
Got Water?
Students determine that delivering clean, fresh water to citizens around the world involves and affects politics, economics, international relations, and technology. They brainstorm a list of factors that might affect their town's...
Curated OER
Water Quality
Students use a microcomputer connected to a conductivity probe to measure the total dissolved solids in local area water samples. Students then compare their measurements with others in their class as well as other standard measurements.
Curated OER
Biomes: Freshwater & Seawater
Students observe organisms behavior and adaptations. In this biomes lesson plan students conduct fieldwork to determine water quality and answer questions about the differences between different habitats.
Curated OER
Tracking the Salt Front
Young scholars manipulate Hudson River salt front data from October 2004 -
September 2005 to locate the high and low points of the salt front for each month, They determine the range for each month, determine the modal range for each...
TeachEngineering
Teach Engineering: One World Ocean
In this activity, students learn about ocean currents and the difference between salt and fresh water. They use colored ice cubes to see how cold and warm water mix and how this mixing causes currents. Also, students learn how surface...
Texas Instruments
Texas Instruments: Dissolved Oxygen
Students use the Dissolved Oxygen Probe to measure the concentration of dissolved oxygen in water from streams and rivers. They correlate the availability of dissolved oxygen to temperature, pressure, and salinity.


