Curated OER
Designing the Perfect Science Fair Project Webquest
Sixth graders examine the Scientific Method and define their topic of interest. Students familiarize themselves with how to utilize their resources and create note cards. Students create their written report and display of their...
Space Awareness
What is Time?
Does it ever seem like time is slipping through your fingers? Model the passing of time with an hourglass activity in which individuals determine whether hourglasses are the most efficient way to measure time.
Shodor Education Foundation
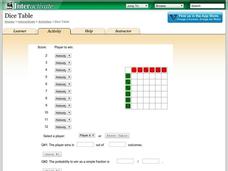
Dice Table
Convert a table to probabilities. Pupils set up the winning rules for the sums of two dice. Using the rules, the applet fills out a table showing the winners for each combination. Learners determine the probabilities of winning for each...
Shodor Education Foundation
Racing Game with One Die
Pupils roll a die to figure out which car advances on a race track. They determine the rules for each car moving forward and, given the statistics of the winner, compare if it matches their predictions.
Shodor Education Foundation
Algebra Four
Everybody wins when you play Algebra Four. Players solve linear and quadratic equations to earn pieces on the Algebra Four game. Make a row of four pieces and you win the game. But everyone gets practice with solving equations, so really...
Curated OER
Interdisciplinary Approach to Investigating Popcorn
Students conduct a lab experiment using the scientific method. In this interdisciplinary lesson plan, students will test the difference in popping white and yellow corn. Students will write their lab report in their science, math,...
Curated OER
Marine Animals: Stranded on the Coast
Students identify marine animals that could become stranded due to coastal features and currents. They plot data on worksheets for locations of sea turtles actually beached or stranded. After plotting their points, they hypothesize...
Curated OER
Understanding Computer Images
Ninth graders explain differences between bitmapped images and vector images. They calculate pixels and transpose the raw file size to bits, bytes, and kilobytes. They compare formats for displaying images on a Web page.
Curated OER
Corrupted Politicians
Students solve problems using statistics and probability. In this math lesson, students analyze how many corrupted members there are in a fictional town council. They give real life examples where statistics and probability can be used.


