Curated OER
Helping Disabled Dogs
Students read a story called Carts Give Mobility to Disabled Dogs and answer vocabulary and comprehension questions about it. In this current events lesson plan, students respond to literature by answering questions, recalling details,...
Learning Games Lab
Logarithm Calculator
Support your young scientists' knowledge of logarithms with a quick video lesson. The instruction first presents the relationship between a base-10 logarithm and an exponential equation. It then demonstrates how to use a calculator to...
Shodor Education Foundation
Racing Game with One Die
Pupils roll a die to figure out which car advances on a race track. They determine the rules for each car moving forward and, given the statistics of the winner, compare if it matches their predictions.
Shodor Education Foundation
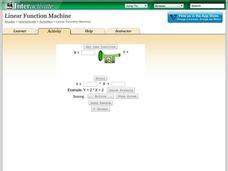
Linear Function Machine
What goes in must come out! Learners play with a function machine to determine the correct function. They enter input values and watch as the machine produces the output.
Shodor Education Foundation
Graphit
No graphing calculator? No worries, there's an app for that! Young mathematicians use an app to graph functions. In addition, they can also plot data points.
Shodor Education Foundation
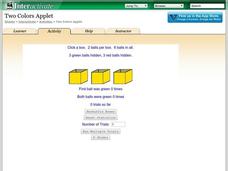
Two Colors Applet
Find the box with two green balls. The applet uses six balls, three green and three red, and hides them in three boxes. Pupils choose a box and click on it to reveal the color of balls inside. Using the chosen box, the simulation keeps...
Shodor Education Foundation
Skew Distribution
Slide the class into a skewed view. Learners alter the location of the median relative to the mean of a normal curve to create a skew distribution. They compare the curve to a histogram distribution with the same skewness.
Learning Games Lab
Scientific Graph Reading
Interpreting graphs is an essential skill for young scientists. An interactive online lesson gives individuals an opportunity to review the components of a graph and learn to read and interpret the shape of a graph. The lesson includes...
Learning Games Lab
The Magic of Reading Graphs
Making conclusions from graphs doesn't need to seem like magic. Learners explore an interactive lesson on reading graphs to strengthen their skills. The content discusses how to read the axes of a graph and draw conclusions based on the...
Curated OER
Math-Money
Students complete money matching worksheet. They work with an aid or peer tutor with coin tray, name each coin shown (use native language or alternative speech method). Alternative assessment methods are used.
California Academy of Science
Fraction Penguin
Exploring mathematics through art is a fun and concrete way to help learners grasp a concept. They will construct a paper penguin using fractions cut from circles. They'll need to determine 1/8, 1/4, and 1/2 of each circle. Once the...
Curated OER
Rounding Decimals
Fourth graders explore rounding a price given in dollar and cents to the nearest dollar. In this math lesson, 4th graders discover how to round to the nearest dollar. Additionally, students practice rounding money for objects that they...
Curated OER
SOS: Save Our Ski Slopes
Young scholars defend downhill skiing as an Olympic Games event by creating a presentation that graphically proves the economic impact and popularity of this event.
Other popular searches
- Severely Disabled Game
- Severely Disabled Reading
- For Severely Disabled
- Severely Disabled Preschool
- Severely Disabled Music
- Severely Disabled Art
- Severely Disabled Lesson
- Severely Disabled p.e.
- Severely Disabled Pe


