Curated OER
Interpreting Functions
Interpreting graphs of functions is addressed in a short worksheet. Distance as a function of time is sketched on a graph, and a few quick questions ask about their meaning. This would make a good short assessment, or a nice worksheet to...
Curated OER
Position and Velocity vs. Time Graphs
In this position and velocity worksheet, students sketch graphs of position vs. velocity and position vs. time for 6 problems given different scenarios. They label their graphs with given positions, velocities and times.
Curated OER
Curve Sketching
In this calculus worksheet, students sketch a curve using a given function. They take the derivative of a function and graph it. There are 10 questions.
Curated OER
Graphing Equations
In this algebra worksheet, young scholars solve linear equations through evaluations and graphing. There are 76 questions ranging from addition to division of linear equations.
Curated OER
Graphs and Derivatives
In this graphs and derivatives worksheet, students graph the derivative of a function. They find the intervals and identify the maximum and minimum. This one page worksheet contains three multi-step problems.
Curated OER
Graphs of Functions
In this function activity, learners sketch graphs of functions, write functions as a composition of two or three functions, and differentiate functions. This three-page activity contains approximately 33 problems.
Curated OER
Functions, Limits, Graphs
In this function worksheet, student determine the limits of given functions and sketch graphs, This two-page worksheet contains 25 problems.
Concord Consortium
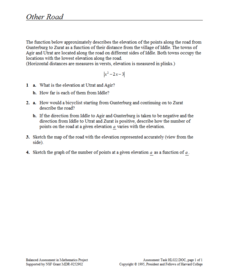
Other Road
Take the road to a greater knowledge of functions. Young mathematicians graph an absolute value function representing a road connecting several towns. Given a description, they identify the locations of the towns on the graph.
Illustrative Mathematics
Identifying Quadratic Functions (Vertex Form)
Pupils calculate the equation of a quadratic in vertex form from a specific graph and determine an equation that would fit the description of a parabola. The final question determines the individuals' understanding of the signs of the...
Illustrative Mathematics
Logistic Growth Model, Abstract Version
Here learners get to flex some serious algebraic muscles through an investigation of logistic growth. The properties of the constant terms in the logistic growth formula are unraveled in a short but content-dense activity. Moving...
Virginia Department of Education
Nonlinear Systems of Equations
Explore nonlinear systems through graphs and algebra. High schoolers begin by examining the different types of quadratic functions and their possible intersections. They then use algebraic methods to solve systems containing various...
Inside Mathematics
Party
Thirty at the party won't cost any more than twenty-five. The assessment task provides a scenario for the cost of a party where the initial fee covers a given number of guests. The class determines the cost for specific numbers of guests...
Illustrative Mathematics
Latitude
The greater the latitude, the less of the Earth is north. Scholars graph the relationship between the latitude and the percentage of the Earth that is north of the latitude. Using the graph and the table, class members interpret values...
Mathematics Assessment Project
College and Career Readiness Mathematics Test A1
A six-page test covers content from several different high school math courses. It incorporates a few short answer, graphing, and word problems. It also allows room for mathematical reasoning and analysis.
EngageNY
Modeling Linear Relationships
Math modeling is made easy with the first installment of a 16-part module that teaches pupils to model real-world situations as linear relationships. They create graphs, tables of values, and equations given verbal descriptions.
Curated OER
Graph Related Linear Inequalities
High schoolers explore the concept of linear inequalities. In this linear inequality lesson, students graph linear inequalities using Microsoft Excel.
Curated OER
Get the Picture with Graphs
Fifth graders examine line, bar and circle graphs in the newspaper and on the Internet. They complete sketches of graphs with an emphasis on selecting the best model to depict the data collected.
Curated OER
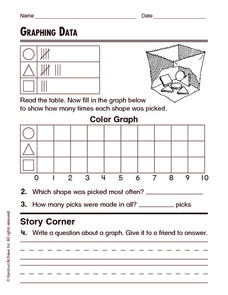
Graphing Data
In this graphing data worksheet, students solve and complete 8 different word problems related to graphing data given. First, they determine the percent of people who do not believe in any of the phenomena described and explain. Then,...
Curated OER
Ice Cream Lab
I scream, you scream, we all scream for ice cream! Even high schoolers enjoy making ice cream. This laboratory exercise has them record the temperature changes throughout the process of liquid becoming solid, graph the results, and...
Curated OER
Vertex Form of Parabolas
Using the method of completing the square, algebra learners rewrite quadratic equations from standard form to vertex form. They will also graph quadratics, stating the vertex and axis of symmetry. Solutions are provided.
Curated OER
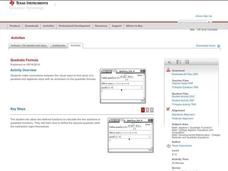
Quadratic Formula
Mathematicians determine the solutions of a quadratic function by looking at a graph. They use the quadratic formula to solve quadratic functions on their Ti-Nspire.
EngageNY
Structure in Graphs of Polynomial Functions
Don't allow those polynomial functions to misbehave! Understand the end behavior of a polynomial function based on the degree and leading coefficient. Learners examine the patterns of even and odd degree polynomials and apply them to...
Flipped Math
Calculus AB/BC - Reasoning Using Slope Fields
Find a solution in the field. An informative video presentation shows pupils how to use the information from a slope field to sketch the graph of a particular solution to a differential equation. Individuals learn how to determine the...
Illustrative Mathematics
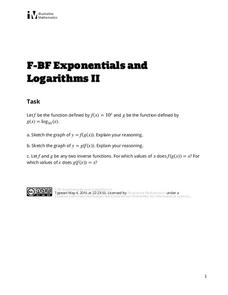
Exponentials and Logarithms II
A simple question sometimes is the best for discussion. High schoolers compare a logarithmic and exponential function and composite them into one another. They graph and compare the difference between the domains. The solution contains...


