Curated OER
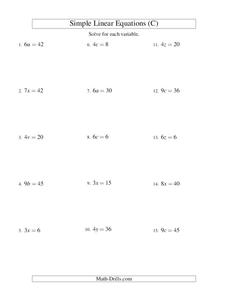
Linear Equations
In this linear equations worksheet, learners solve linear equations using a given variable. This two-page worksheet contains approximately 36 problems. Answers are provided on the last page.
Curated OER
Count the Differences
Pupils find the difference between consecutive y-values on the calculator and write an equation that fits the data. They continue finding the differences in consecutive y-values using lists on their calculator. Learners...
Curated OER
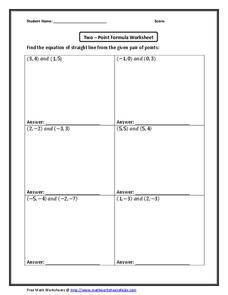
Two-Point Formula Worksheet
In this linear equation worksheet, students determine the equation of a line when given two points. This two-page worksheet contains 6 problems. Answers are provided on the last page.
Curated OER
Hold A Hill
Students inspect soil erosion. In this soil erosion instructional activity, students examine the causes of soil erosion and discover ways to conserve the landscape.
West Contra Costa Unified School District
Multiple Representations of Equations
class members first work through finding the equation, table of values, graph, and key features of a linear function expressed verbally. Individuals then work through several more problems given different representations.
Teach Engineering
Forms of Linear Equations
Linear equations are all about form. The fifth part in a unit of nine works with the different equivalent forms of linear equations. Class members become familiar with each form by identifying key aspects, graphing, and converting...
5280 Math
Triangle Area Patterns
Combine algebraic and geometric strategies to find solutions. The task asks learners to find the coordinates of a third vertex of a triangle to create a triangle with a specific area. The project is a set of seven problems that...
Virginia Department of Education
Linear Modeling
An inquiry-based algebra lesson plan explores real-world applications of linear functions. Scholars investigate four different situations that can be modeled by linear functions, identifying the rate of change, as well as the...
Cornell University
Math Is Malleable?
Learn about polymers while playing with shrinky dinks. Young scholars create a shrinky dink design, bake it, and then record the area, volume, and thickness over time. They model the data using a graph and highlight the key features of...
InqueryPhysics
Interpreting Motion Graphs
Every movement in the world can be measured and even motionless objects can be significant indicators of movement. Focus on motion graphs that feature distance vs. time, speed vs. time, and positive and negative acceleration.
Balanced Assessment
On Averages and Curves
Determine the average on a curve. The class finds graphical representations of averages and expresses them both symbolically and on the graph. The assessment requires class members to justify using average to describe graphs.
PBL Pathways
College Costs
Predict the year that college costs will double in your state using linear modeling. The first part of this two-part project based learning activity asks young mathematicians to use data from the College Board. They graph the data,...
Curriculum Corner
8th Grade Math "I Can" Statement Posters
Clarify the Common Core standards for your eighth grade mathematicians with this series of classroom displays. By rewriting each standard as an achievable "I can" statement, these posters give students clear goals to work toward...
EngageNY
Motion Along a Line – Search Robots Again
We can mathematically model the path of a robot. Learners use parametric equations to find the location of a robot at a given time. They compare the paths of multiple robots looking for parallel and perpendicular relationships and...
101 Questions
25 Billion Apps
Learn to use mathematics to your advantage! Using linear modeling, scholars predict the date and time the Apple App Store reaches 25 billion downloads. Considering the prize for the 25 billionth download was a $10,000 gift card, modeling...
CCSS Math Activities
Smarter Balanced Sample Items: 8th Grade Math – Claim 2
Math can be a problem in eighth grade. Sample items show how problem solving exists within the eighth grade standards. Part of the Gr. 8 Claim 2 - 4 Item Slide Shows series, the presentation contains eight items to illustrate the...
American Statistical Association
Scatter It! (Predict Billy’s Height)
How do doctors predict a child's future height? Scholars use one case study to determine the height of a child two years into the future. They graph the given data, determine the line of best fit, and use that to estimate the height in...
American Statistical Association
Scatter It! (Using Census Results to Help Predict Melissa’s Height)
Pupils use the provided census data to guess the future height of a child. They organize and plot the data, solve for the line of best fit, and determine the likely height and range for a specific age.
Curriculum Corner
8th Grade Math Common Core Checklist
Ensure your eighth graders get the most out of their math education with this series of Common Core checklists. Rewriting each standard as an "I can" statement, this resource helps teachers keep a record of when each standard was...
Curated OER
Expressing Geometric Properties with Equations
Algebra and geometry are not interchangeable. Demonstrate why not with a series of problems that deal with the equations of circles and equations of lines that meet specific criteria.
Statistics Education Web
Text Messaging is Time Consuming! What Gives?
The more you text, the less you study. Have classes test this hypothesis or another question related to text messages. Using real data, learners use technology to create a scatter plot and calculate a regression line. They create a dot...
5280 Math
Aquarium Equations
Take a look at linear functions in a new environment. A three-stage algebra project first asks learners to model the salt concentration of an aquarium using linear functions. Then, using iterations, pupils create a set of input-output...
Mathematics Vision Project
Module 1: Transformations and Symmetry
No need to change anything about the resource. The first of eight modules in the MVP Geometry unit focuses on transformations in the coordinate plane. It connects translations, rotations, and reflections to congruence, symmetry, and...
American Statistical Association
What Fits?
The bounce of a golf ball changes the result in golf, mini golf—and a great math activity. Scholars graph the height of golf ball bounces before finding a line of best fit. They analyze their own data and the results of others to better...
Other popular searches
- Slope Intercept Form
- Slope of a Line
- Slope and Y Intercept
- Finding Slope
- Slope Intercept
- Algebra Projects on Slope
- Point Slope
- Point Slope Form
- Slope Rate of Change
- Slope Formula
- Slope Intercept Form
- Point Slope Formula


