Illustrative Mathematics
Find the Change
This exercise is an opportunity for algebra learners to understand the connection between the slope of a line and points found on the line. Use similar triangles to explain why slope m is the same between any two points. Discuss with the...
Curated OER
US Airports, Assessment Variation
Determining relationships is all part of algebra and functions. Your mathematicians will decide the type of relationship between airports and population and translate what the slope and y-intercept represent. The problem is multiple...
Georgetown University
Cup-Activity: Writing Equations From Data
Determine how cup stacking relates to linear equations. Pupils stack cups and record the heights. Using the data collected, learners develop a linear equation that models the height. The scholars then interpret the slope and the...
Curated OER
Algebra I - Worksheet G12: Graphing Lines
In this graphing lines worksheet, students graph 28 lines given various data. Students graph lines given two points, a point and slope, and a line perpendicular or parallel to a point.
Curated OER
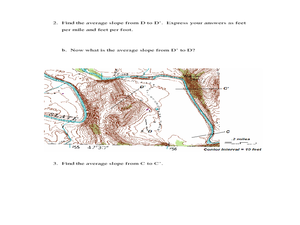
Slope and Topographic Maps
Students investigate slopes as they study topographic maps. In this algebra lesson, students discuss and apply the concept of slopes to graphing and analyzing data.
Curated OER
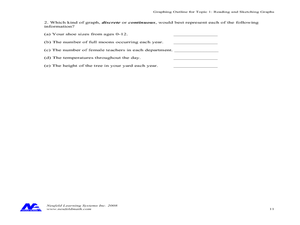
Reading and Sketching Graphs
In this graphs worksheet, students answer 15 multistep questions about graphs. Students determine distance traveled, time, velocity, and create scenarios to fit the graph.
Curated OER
Graphs and Functions
Middle schoolers describe plotting functions on the Cartesian coordinate plane. They solve functions on paper and using an online tool to plot points on a Cartesian coordinate plane creating lines and parabolas.
EngageNY
Analyzing a Graph
Collaborative groups utilize their knowledge of parent functions and transformations to determine the equations associated with graphs. The graph is then related to the scenario it represents.
CK-12 Foundation
Graphs of Linear Functions: Line Designs
Designs from lines are sublime. Scholars create colorful designs by connecting points on an interactive coordinate plane. They answer questions about slope and quadrants based on their designs.
Curated OER
Rise Over Run
Students define the slope of the line, find the slope between any two points on the line, and allow them to name other areas where the slope is used. They explain why the slope is defined as the rise over the run.
Curated OER
Find Slope from the Graph
In this algebra worksheet, students are given a graph with a line and two points and are expected to find the slope. There are 4 problems with an answer key.
Teach Engineering
Matching the Motion
It is not always easy to walk the straight and narrow. In the sixth portion of a nine-part unit, groups actively recreate a graph depicting motion. Individuals walk toward or away from a motion detector while trying to match a given...
EngageNY
Increasing and Decreasing Functions 1
Model situations with graphs. In the fourth installment of a 16-part module, scholars learn to qualitatively analyze graphs of piecewise linear functions in context. They learn to sketch graphs for different situations.
Curated OER
Birds' Eggs
More than just data, scatter plots are full of information that can be used to answer a variety of questions. This lesson uses a plot with information about bird egg sizes to answer questions about the relationship between length and...
Shodor Education Foundation
Function Flyer
Fly through graphing functions with the Function Flyer. Young mathematicians use an interactive to graph different types of functions. A set of exploration questions has users investigate patterns in functions.
Curated OER
Slope-Intercept Form of a Line
Students determine how the slope affects the graph of a line. They relate "b" to the "y"-intercept of a line and solve the equation of a line given "m" and "b." They are given scenarios and possible answers to which they explain why or...
Curated OER
Graphing Speed
For this graphing worksheet, students read about independent and dependant variables and learn how to determine speed from the slope of a position vs. time graph. This worksheet has 4 matching, 17 fill in the blank, and 2 problems to solve.
Curated OER
An Exploration of the Slope of a Line
Students define the slope of a line. In this algebra lesson, students differentiate between parallel and perpendicular lines using their slopes. They rewrite equations in slope intercept form and explain the meaning of the slope.
Curated OER
Basic Algebra and Computers: Spreadsheets, Charts, and Simple Line Graphs
Young scholars, while in the computer lab, assess how to use Microsoft Excel as a "graphing calculator." They view visual representations of line graphs in a Cartesian plane while incorporating basic skills for using Excel productively.
Curated OER
Slope Fields
Students create and analyze slope fields. In this calculus lesson, students create a visual of differential equations. They use the Ti Navigator to create slope fields.
Curated OER
A Line Graph of the Ocean Floor
Young scholars develop a spreadsheet and import the information into a line graph. In this spreadsheet and line graph lesson, students develop a spreadsheet of ocean depths. They import the information into a word processed document....
Curated OER
Graphing at all Levels: It's a Beautiful Thing!
Mixing math and art is done in this lesson by applying graphing knowledge to create a unique piece of art. This lesson varies acording to the graphing knowledge of the artist. First, learners identify and review various types of graphing...
Curated OER
Investigating the Slopes of Parallel and Perpendicular Lines
High schoolers investigate parallel and perpendicular lines. They use Cabri Jr. to construct and explore the relationships between the slopes of parallel and perpendicular lines. The drawing and measurement tools available with Cabri Jr....
Alabama Learning Exchange
Investigating School Safety and Slope
Learners investigate the slope of various stairways through a "news report" approach and employ mathematical knowledge of applied slope to report on wheelchair accessibility and adherence to Americans with Disabilities Act. They...


