Curated OER
My Test Book: Stem and Leaf Plots
In this math skills worksheet, students solve 10 multiple choice math problems which require they interpret a stem and leaf plot. Students may view the correct answers.
Curated OER
Loving Literature
First graders, after having "Are You My Mother?" by P.D. Eastman read to them, participate in group discussions or independentally work to analyze a spreadsheet to identify essential elements in the story and graph their data. In...
Curated OER
My Test Book: Stem and Leaf Plots
In this math skills worksheet, students solve 10 multiple choice math problems regarding stem and leaf plots. Students may view the correct answers.
Curated OER
The Box Problem
Students create graphic, algebraic and verbal ideas of functions. In this algebra lesson, students graph functions and identify the zeros of the functions. They find the domain and range and classify functions as relation or not.
Curated OER
Problem Solving Using Pattern Blocks
Students use pattern blocks to create a figure that is described to them and establish a pattern based on the description of the geometric figure. In this pattern blocks lesson plan, students fill out shape and fraction worksheets.
Curated OER
Eulerian Paths and Circuits
Students explore the concept of euler paths and circuits. In this euler paths and circuits lesson, students discuss the bridges of Königsberg problem. Students discuss how to determine if an euler circuit exists. Students discuss the...
Curated OER
The Rabbit Problem
Students notice a number pattern in the book The Rabbit Problem by Emily Gravett. In this number pattern instructional activity, students represent and describe numbers appropriate to their grade level.
Curated OER
What's Your Line?
Fifth graders collect temperature readings over a period of time, enter the information into a spreadsheet and choose the appropriate graph to display the results.
Curated OER
Batting the Unknown
Pupils use batting averages to provide a measure of a player's past success. They use Algebra to calculate required performance to improve the average. Students compare baseball batting statistics early in the season and late in the...
Curated OER
Rainbow Fish Graphing
Students graph different colors of rainbow fish scales after participating in a shared reading of The Rainbow Fish. They answer questions based on the graph. They practice making graphs independently using colored cereal circles.
Fuel the Brain
Interpret Pictographs
Have your youngsters use a graphic organizer and key to solve the following questions. By learning to interpret the pictographs, they will solve the problems accurately.
Curated OER
Gingerbread Man Math
Students collect and explore gingerbread man data. In this math and technology lesson plan, students examine how to organize and interpret data in three formats: objects, pictures, and graphs.
Curated OER
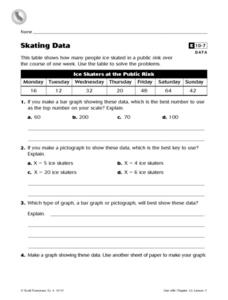
Skating Data
In this collecting data worksheet, 4th graders view a table on ice skaters at a public rink in order to answer 2 multiple choice questions, 1 short answer question and make a graph showing one piece of the data.
Curated OER
Data Handling: Tally Chart on Illnesses
In this tally chart worksheet, students analyze a chart showing childhood illness cases. Students use the tally chart to solve 6 problems.
Curated OER
Statistics: Reading and interpreting production graphs
Students interpret and create different types of graphs. They analyze data from charts, develop a survey and design appropriate graphic illustrations and make a presentation.
Curated OER
Songs from the Past
Learners research songs from the past to learn about historical events. In this music history lesson plan, students conduct a survey on the Star-Spangled Banner, research the song and history on various websites, and research songs in...
Curated OER
Too Many Tulips
In this graphing information worksheet, students read 6 sentences and then fill in the chart with the appropriate information from the sentences.
Curated OER
Pounds of Paper
In this collecting of data instructional activity, 2nd graders study and analyze a pounds of paper table in order to solve and answer 6 mathematical questions.
Curated OER
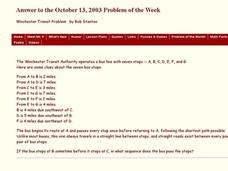
Winchester Transit Problem
In this transit problem worksheet, students read clues about bus stops and their routes. They determine the time between stops and the shortest path possible. This one-page worksheet contains 1 multi-step problem. The answer is provided.
Curated OER
And Now…the Supply Curve!
For this economics worksheet, students use their problem solving skills to respond to questions regarding the supply curve and its impact on an individual's lemonade stand business.
Curated OER
Using a Thermometer
First graders use their senses to formulate questions and make predictions to determine what is in the "Wonder Bag". They hold pieces of ice and examine while listing descriptors on a chart and then take their own temperature using an...
Curated OER
Histograms
In this histograms learning exercise, students solve 5 word problems based on a histogram of presidential ages at their inauguration. Next, students create a frequency table and a histogram based on a list of data which shows the average...
Curated OER
Comparing Costs
Students compare the costs of two cellular phone plans and determine the best rate. They use a table and a graph of points plotted on a Cartesian plane to display their findings. Students write an equation containing variables that could...


