American Statistical Association
Scatter It! (Predict Billy’s Height)
How do doctors predict a child's future height? Scholars use one case study to determine the height of a child two years into the future. They graph the given data, determine the line of best fit, and use that to estimate the height in...
Inside Mathematics
Vencent's Graphs
I like algebra, but graphing is where I draw the line! Worksheet includes three multiple-part questions on interpreting and drawing line graphs. It focuses on the abstract where neither axis has numbers written in, though both are...
Inside Mathematics
Scatter Diagram
It is positive that how one performs on the first test relates to their performance on the second test. The three-question assessment has class members read and analyze a scatter plot of test scores. They must determine whether...
American Statistical Association
You and Michael
Investigate the relationship between height and arm span. Young statisticians measure the heights and arm spans of each class member and create a scatter plot using the data. They draw a line of best fit and use its slope to explain the...
Radford University
A Change in the Weather
Explore the power of mathematics through this two-week statistics unit. Pupils learn about several climate-related issues and complete surveys that communicate their perceptions. They graph both univariate and bivariate data and use...
Curated OER
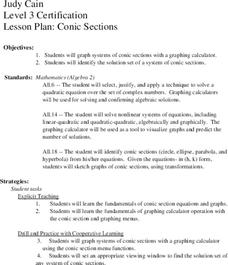
Conic Sections
Students, while using a graphing calculator, graph systems of conic sections as well as identify their solutions. They complete various word problems dealing with conic sections with their calculators. In addition, students sketch graphs...
Curated OER
Graphing and the Coordinate Plane
Students examine the four quadrants of Cartesian coordinate plane. They play maze games and coordinate games to discover how to read and plot points on the plane. Students plot points on the coordinate plane and examine the ratio of...
Achieve
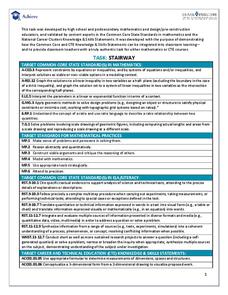
Stairway
It's the stairway to learning! Scholars research all aspects of building a staircase. Using information from building codes, they write and graph a system of inequalities to analyze the constraints. The completed project is a scale model...
MARS, Shell Center, University of Nottingham
Defining Regions Using Inequalities
Your young graphers will collaboratively play their way to a better understanding of the solution set produced by the combining of inequalities. Cooperation and communication are emphasized by the teacher asking questions to guide the...
Illustrative Mathematics
Lake Algae
Introduce learners to exponential growth with this real-world problem about algae that is rapidly spreading across a lake in a city park. The task presents the rate of growth and an end value and asks learners to determine what happened...
Curated OER
Reading Graphs
Middle schoolers practice plotting functions on the Cartesian coordinate plane, see several categories of functions, including lines and parabolas, and read a graph, answering questions about the situation described by the graph
Curated OER
Reading Graphs
Students plot functions on the Cartesian coordinate plane. They explore lines and parabolas. Students analyze graphs and answer questions about the information presented on the graph using an online program.
Curated OER
Graphing and the Coordinate Plane
Students learn about the Cartesian coordinate plane, understand the four quadrants of the Cartesian coordinate plane, and plot points on the plane. Students read coordinates for a point from a graph and give the ratio of rise over run...
Curated OER
Algebra I Project: Make Your Own Business
Students explore the concept of algebra in real world situations. In this economics lesson plan, students design, plan, run, and evaluate a small business. Students will create a product, market the product, and try to make a profit.
Curated OER
What Are The Chances
Students calculate the probability of an event occurring. In this probability lesson, students differentiate between independent, dependent or compound events. They find the range of the data.
Curated OER
The Mandelbrot Set
Students are introduced to the notion of a complex number and function iteration in order to motivate the discussion of Julia sets and the Mandelbrot set.
Curated OER
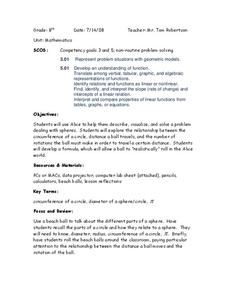
Circle Relationships
Students explore circles. In this geometry lesson, students explore the relationship between the circumference of a circle, the distance a ball travels, and the number of rotations the ball must make in order to travel a certain...
Curated OER
The Mandelbrot Set
Learners explore the Mandelbrot Set. They are introduced to the concept of a complex number and function in order to motivate the discussion of Julia and Mandelbrot sets. Students investigate fractals and how they are built.
Curated OER
Topic 5: Running the Business
Young scholars explore the concept of running a business. For this running a business lesson, students put their plan of action into practice. Young scholars market a product and try to maximize profit.
Curated OER
Topic 6: Evaluating and Presenting Results
Young scholars construct spreadsheets from raw data. In this spreadsheet construction activity, students compile data into Microsoft Excel. Young scholars familiarize themselves with entering and presenting data in a spreadsheet.
Curated OER
Power, Work and the Waterwheel
Students use a two-liter bottle, dowel rod and index cards to design and construct a water wheel. They then calculate the power created and measure the work done by the water wheel in Watts and Joules.
Curated OER
Modeling With Circular Functions
Students explore circular functions. They identify the amplitude, period, phase shift and vertical shift of circular functions. Students analyze phenomena described by sine waves and they find mathematical models for transforming images...
Curated OER
Tilted Squares and Right Triangles
Students investigate squares. They generate patterns from structured situations and find a rule for the general term and express it using words and symbols. Students generate patterns from a rule and substitute values and formulas.
Cuemath
Cuemath: Linear Equations in One Variable
A comprehensive guide for learning all about linear equations in one variable with definitions, how to solve them, solved examples, and practice questions.


