Physics Classroom
Using Graphs
Many university professors complain incoming scholars struggle with interpreting graphs. A skill builder offers three different types of exercises including calculating slope, interpreting graphs, and extrapolating outside the plotted...
CK-12 Foundation
Using Quadratic Equations to Solve Problems: Construct a Soccer Field
Build a soccer field through a little mathematical analysis. Individuals manipulate the dimensions of a soccer field as they drag points to new positions. The simulation shows the corresponding intercepts and area. As pupils explore the...
CK-12 Foundation
Problem-Solving Models: Subway vs. Taxi
Ride to success in understanding systems of equations. Scholars graph a system of equations on the cost of a subway and a taxi using an interactive. Using this graph allows users to answer some questions about the situation.
Curated OER
Graphing of Functions Using First and Second Derivatives
In this calculus learning exercise, students solve problems using the first and second derivatives. They define the behavior of the function based on the derivative. There are 11 questions with an answer key.
Physics Classroom
Graph That Motion
Pupils apply their knowledge of the shape and slope of graphs to interpret the motion of an object. Three levels of difficulty provide plenty of practice with support thanks to the "Help Me!" button offered with each question.
Physics Classroom
Position-Time Graphs
Three sections review the key skills covered in a series on dimensional kinematics. The first covers the difference between distance and displacement. The second addresses the relationship between velocity and slope. The third includes...
CK-12 Foundation
Single Bar Graphs: Hockey Teams
Raise the bar for hockey fans. Using data about favorite hockey teams, pupils build a bar graph. They use the information from the graph to make comparisons and solve one- and two-step problems.
Curated OER
Word Problems
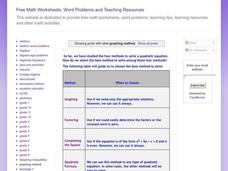
In this algebra worksheet, students are guided to choose the best method to solve problems using graphing, factoring, completing the square, and quadratic formula. There are 4 problems with an answer key.
Physics Classroom
Dots and Graphs
Scholars demonstrate understanding of kinematic graphs through matching dot graphs to position time graphs, dot graphs to velocity graphs, and a mixture of the two. If users feel stuck or confused, a Help Me! button offers an explanation...
Curated OER
Selecting the Best Method for Solving Quadratic Equations
In this solving quadratic equations worksheet, students select the best method to solve a quadratic equation and then solve five quadratics. Fully worked examples are provided.
Curated OER
Chart problems involving car defects and customer service departments
In this interactive worksheet, students solve two problems using the charts provided. Students must convey they are able to understand charts and how to read them.
Physics Classroom
Distance vs. Displacement
Home is where your displacement is zero. Scholars practice solving distance versus displacement problems of increasing difficulty. They begin with two stage motion and, by the wizard level, each problem has four stage motion to consider....
CK-12 Foundation
Graphs Using Slope-Intercept Form: Mountain
Climb every mountain, even one you create in an interactive. Individuals solve a problem involving slopes and distances of campsites on a mountain. Answering a set of challenge questions aids in the process.
CK-12 Foundation
Translating Sine and Cosine Functions: Translating Sine
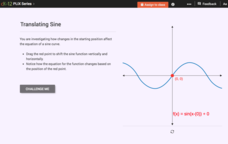
Learn how to slide sine back and forth and up and down. Pupils move the starting point of a graph of sine vertically and horizontally. They investigate the changes to the equation of the graph in relationship to the translation. They...
CK-12 Foundation
Comparison of Unit Rates: Drive Away
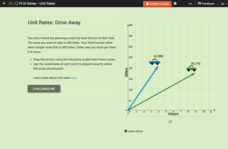
Five questions make up an interactive that challenges mathematicians to compare unit rates. Word problems question scholars about two friends going on a road trip. Scholars manipulate two cars on a coordinate plane to help solve word...
CK-12 Foundation
Discriminant
Discriminate between the types of roots. The interactive root introduces the discriminant and its connection to the types and number of roots. Pupils use a slider to view graphically the effect of the sign of the discriminant on a...
Curated OER
Problem Solving 1
In this online interactive problem solving worksheet, students examine a diagram and use their problem solving skills in order to respond to 5 questions.
Curated OER
My Test Book: Reading Graphs
In this online interactive math skills worksheet, students solve 10 multiple choice math problems that require them to read and interpret graphs. Students may view the correct answers.
Curated OER
My Test Book: Reading Graphs
In this online interactive math skills worksheet, students solve 10 multiple choice math problems that require them to read and interpret graphs. Students may view the correct answers.
Physics Classroom
Balanced vs. Unbalanced Forces
Scientists use many different kinematic representations of motion. Review each of them with the help of an engaging interactive that is part of a larger series on Newton's laws of motion. The resource provides three levels of challenge...
Curated OER
Problem Solving 1
In this online interactive problem solving worksheet, students read a graph and use their problem solving skills in order to respond to 10 questions.
Curated OER
Exploring Slope
In this exploring slope worksheet, students solve and complete 4 different problems. First, they compare an object's weight on Earth to an object's weight on another planet using the information given. Then, students compare this...
Curated OER
Solve Five Quadratic Equations Using the Quadratic Formula
In this solving quadratic equations worksheet, students solve five quadratic equations by using the quadratic formula. Students also review using the discriminant, solving by factoring, and solving by completing the square. ...
CK-12 Foundation
Linear Programming: Bakers' Dilemma
Place the pies in a line. Pupils create a graph of a system of linear inequalities to represent the number of pies a bakery can make. Learners analyze the vertices on the graph to determine the number of pies they can bake without...


