American Institutes for Research
Digital Smiles
Explore metric measurement, recording data, and creating an electronic spreadsheet displaying results with your math class. Scholars will measure the length of their smiles, record the measurements, and represent the results on an...
Virginia Department of Education
Mystery Iron Ions
Young chemists perform an experiment to determine if a compound is iron (II) chloride or iron (III) chloride. Then they determine the formula, balance the equation, and answer analysis questions.
Chicago Botanic Garden
Micro-GEEBITT Climate Activity
A truly hands-on and inquiry based learning activity bridges all the lessons in the series together. Beginning with a discussion on average global temperatures, young meteorologists use real-world data to analyze climate trends in order...
Curated OER
Design Your Own Bedroom
Students use metric measurement to perform operations on decimals and percentages. They represent their mathematical problem by using a spreadsheet.
Curated OER
Graphing Using Excel
Fifth graders complete a series of graphs by gathering information and using Excel to graph the information. In this graphing lesson plan, 5th graders graph favorite desserts of the class. Student put their results into the computer and...
Curated OER
Using a Spreadsheet to Solve Gas Law Problems
Students use a spreadsheet to solve gas law problems. In this gas laws lesson plan, students use the Express Calc program to load a spreadsheet for the gas law problems. Students compute volume, temperature, or pressure according to the...
Curated OER
Using Excel To Teach Probability And Graphing
Students engage in the use of technology to investigate the mathematical concepts of probability and graphing. They use the skills of predicting an outcome to come up with reasonable possibilities. Students also practice using a...
Curated OER
Pythagorean Theorem Spreadsheet
Studetns use a spreadsheet to organize data on the sides of a triangle. They use the Pythagorean Theorem and the If then spreadsheet function to decide whether the three sides determine a right triangle. Students work individual...
Curated OER
Using Tables to Solve Linear Functions
Oh that intercept! Budding algebra masters solve linear equations from standard to intercept form. They identify the slope and y-intercept to help graph the lines, an then create coordinate pairs using a table of values. Great TI tips...
EngageNY
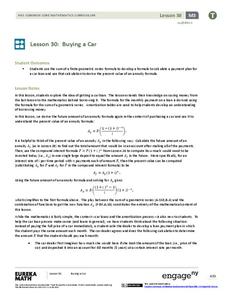
Buying a Car
Future car owners use geometric sums to calculate payments for a car loan in the 31st installment of a 35-part module. These same concepts provide the basis for calculating annuity payments.
Concord Consortium
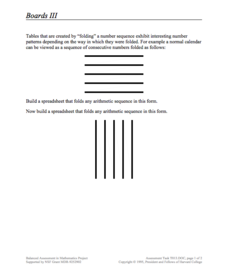
Boards III
Learn to visualize mathematical patterns as a folded pattern. Beginning with a visual display, the task encourages pupils to view sequences as a folded table. The pattern of the table then becomes a formula in a spreadsheet that...
Inside Mathematics
Graphs (2006)
When told to describe a line, do your pupils list its color, length, and which side is high or low? Use a instructional activity that engages scholars to properly label line graphs. It then requests two applied reasoning answers.
Inside Mathematics
Rugs
The class braids irrational numbers, Pythagoras, and perimeter together. The mini-assessment requires scholars to use irrational numbers and the Pythagorean Theorem to find perimeters of rugs. The rugs are rectangular, triangular,...
Curated OER
Credit Cards: The Good, the Bad, and the ugly
Students study how dangerous credit cards can be. They see why it is important to pay off credit card bills as soon as they can. They use MS Excel to display and understand the data. They fill out questions using the data from their...
Curated OER
A Fishy Tale
Eighth graders do a research project on a particular species of Atlantic seafood and record and graph information pertaining to commercial landings of that species of seafood. They use a website and an Appleworks spreadsheet.
Curated OER
Three Squirrels and a Pile of Nuts
Learners solve story problems using a spreadsheet in combination with various problem-solving strategies. Working in teams of three, students create attempt to solve a story problem using three different methods; using manipulative,...
Curated OER
Let's Keep Track of Grades
Students participate in a technology project. This lesson is a hands-on spreadsheet project where students are responsible for keeping track of their grades for class. The students learn to enter data into a spreadsheet, create...
Curated OER
Multiplication Tables Using Microsoft Excel
Eighth graders are introduced to Microsoft Excel as a computer application software program. They create multiplication tables in Microsoft Excel. Students work in small groups. They discuss the $ (anchor) function in Microsoft Excel.
Curated OER
Spreadsheet Project: Planning a Party
Students create a spreadsheet and stay within a budget as they plan a class party for the next holiday.
Curated OER
4 Month Budget Spreadsheet
Eighth graders create and maintain a spreadsheet budget based on a predetermined salary. They have an opportunity to make "investments and purchases." Budget records be kept for an imaginary 4 month period.
Curated OER
Technology Integration Lesson Plan: Civil War Spreadsheet
Eighth graders discuss and analyze Civil War data, manually graph data on handout, work with partners to enter data into spreadsheets, and create charts on spreadsheet for each data set.
Curated OER
Data Analysis and Probability: Graphing Candy with Excel
Collect and graph data using Microsoft Excel with your math class. They will make predictions about the number of each colored candy in a bag of M&M's, then sort, classify, count, and record the actual data before using Excel to...
Noyce Foundation
Pizza Crusts
Enough stuffed crust to go around. Pupils calculate the area and perimeter of a variety of pizza shapes, including rectangular and circular. Individuals design rectangular pizzas with a given area to maximize the amount of crust and do...
Curated OER
Lunch Menu Calories tracking project
In this lunch menu learning exercise, learners make a spreadsheet where they count the calories of different food items on the lunch menu, chart their findings, and answer short answer questions. Students answer 5 questions.


