EngageNY
Interpreting the Standard Deviation
Does standard deviation work for non-symmetrical distributions, and what does it mean? Through the use of examples, high schoolers determine the standard deviation of a variety of distributions and interpret its...
EngageNY
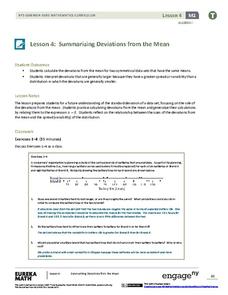
Summarizing Deviations from the Mean
Through a series of problems, learners determine the variability of a data set by looking at the deviations from the mean. Estimating means of larger data sets presented in histograms and providing a way to calculate an...
Curated OER
Analytical Problem Solving
High schoolers explore about propagation of error in calculations using experimental data. They develop their weighing and pipetting techniques. Students explore the following terms: Standard deviation and relative standard deviatin....
Curated OER
Confidence Intervals: Population Mean; Population standard Deviation Known
In this confidence interval worksheet, students examine a given confidence level and sample data to determine the margin of error, identify a confidence interval, list the mean and give the standard deviation. Students complete seven...
EngageNY
Measuring Variability for Symmetrical Distributions
How do we measure the deviation of data points from the mean? An enriching activity walks your class through the steps to calculate the standard deviation. Guiding questions connect the steps to the context, so the process...
Virginia Department of Education
Calculating Measures of Dispersion
Double the fun — calculate two measures of deviation. The lesson plan provides information to lead the class through the process of calculating the mean absolute deviation and the standard deviation of a data set. After learning how to...
Virginia Department of Education
Organizing Topic: Data Analysis
Learners engage in six activities to lead them through the process of conducting a thorough analysis of data. Pupils work with calculating standard deviations and z-scores, finding the area under a normal curve, and sampling...
Curated OER
A Lesson In Standard Deviation
Students develop an informal understanding of standard deviation by having students find the mean and standard deviation of their hometown and comparing them to a town with a similar mean but a different standard deviation.
Curated OER
Using Standard Deviation, part 2
Students explain and learn the practical application of standard deviation. They compare cities in the U.S. and discover whether cities closer to the ocean have more consistent temperatures. Useful resources are given.
Curated OER
The Bell Curve
Learners are introduced to the concepts of the normal curve, skewness and the standard deviation. They discuss how the normal distribution has been used and misused to support conclusions.
Curated OER
Mean, Variance, and Standard Deviation for the Binomial Distribution
Students review previous lessons on mean, variance, standard deviation, and expected value. They utlize formulas for these characteristics that are specifically designed for the binomial distribution. Students discuss the similarities...
Curated OER
Mean and Standard Deviation
Get two activities with one lesson. The first lesson, is appropriate for grades 6-12 and takes about 20 minutes. It introduces the concept of measures of central tendency, primarily the mean, and discusses its uses as well as its...
Curated OER
Application and Modeling of Standard Deviation
The first activity in this resource has learners computing the mean and standard deviation of two different data sets and drawing conclusions based on their results. The second activity has them using a dice-rolling simulation to...
American Statistical Association
Bear Hugs
Scholars research arm span to determine who gives the best bear hugs. They use data from a national study to find the standard statistics for arm span. It includes mean, median, quartiles, spread, standard deviation, and more.
Curated OER
Hydrogen Peroxide Analysis
A scenario is presented for chemistry techs to address. Using titration techniques, they must analyze hydrogen peroxide solution samples. They evaluate accuracy and precision in the process. They also gain experience consulting the MSDS...
Curated OER
Effects of Temperature, Deviation on Climate
Students collect and record data for a given city. They calculate standard deviation of temperature and analyze the impact of climate changes on a city's and culture.
Curated OER
Confidence Intervals: Population Mean; Population Standard Deviation Unknown
In this confidence interval worksheet, students examine given statistical information to find the margin of error. They construct a confidence interval for the population and find the mean. Seven statistical problems are available on...
Curated OER
Human Face of Mathematics - Mathematics in Aboriginal Culture
Students collect statistical data. In groups, students play a dart game and then determine the distance between darts. They collect the data and plot the information on a coordinate plane. They identify the mean and the...
Virginia Department of Education
z-Scores
Just how far away from the mean is the data point? Pupils calculate the standard deviation for a set of data and find out how many standard deviations a point is away from the mean. The teacher leads a discussion on how to calculate...
EngageNY
Distributions—Center, Shape, and Spread
Data starts to tell a story when it takes shape. Learners describe skewed and symmetric data. They then use the graphs to estimate mean and standard deviation.
American Statistical Association
Armspans
Young mathematicians collect data on the arm spans of classmates. Then they sort the data by measures of center, spread, and standard deviation. Finally, they compare groups, such as boys and girls, to interpret any differences.
EngageNY
Measuring Variability for Skewed Distributions (Interquartile Range)
Should the standard deviation be used for all distributions? Pupils know that the median is a better description of the center for skewed distributions; therefore, they will need a variability measure about the median for those...
Curated OER
Measuring Dispersion
Students compute the standard deviation for a given set of data. In this measuring dispersion lesson plan, students compute the mean, and then the distance from the mean for each data point. They find the standard deviation of the data.
Curated OER
The Statistics of Shoes
Students open a blank spreadsheet and format it for a class survey about the number of shoes owned by the men and women in the class. They enter the data before finding the mean, median, mode, quartiles, variance, and the standard...
Other popular searches
- Standard Deviation and Mean
- Mean Standard Deviation
- Math Standard Deviation
- Standard Deviation Z Score
- Chemistry Standard Deviation
- Standard Deviation Computer
- Mean, Standard Deviation
- Standard Deviation Madekine
- Standard Deviation Made Kine


