Curated OER
Global Warming Statistics
Students research real-time and historic temperature data of U.S. and world locations, and analyze the data using mean, median, and mode averages. They graph the data and draw conclusions by analyzing the data. A spreadsheet is used to...
Curated OER
Review for an Exam
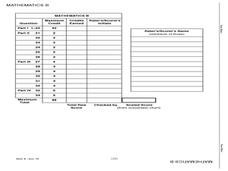
In this math worksheet, students review for the Regents Exam by doing problems related to algebra, geometry and everyday stats. There are 34 questions.
Curated OER
Candy Problem
In this stats worksheet, students identify how many ways there are to split 25 pieces of candy in between 3 people. There is a very detailed answer key with this problem.
Curated OER
Stats on Reduced-Fat
Learners demonstrate an understanding of the Five-Number Summary and Box-Plots after analyzing data from nutrition labels, forming a hypothesis and supporting it. They decide if there is a significant difference between reduced fat and...
Curated OER
Patterns of International Tourism in Canada
High schoolers retrieve data on the number of international tourists to Canada, analyzing the seasonal patterns and long-term trends for each region in Canada. They retrieve statistical data from E-STAT; and explain the effect of...
Curated OER
The Great Potato Hunt
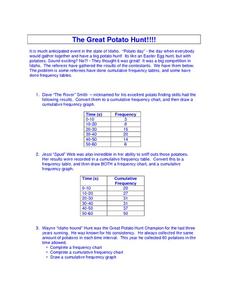
In this science worksheet, students examine the data from the potato hunt where potatoes are found like Easter Eggs. The data of the number of potatoes found is recorded in the frequency tables.
Curated OER
PDF's and PMF's
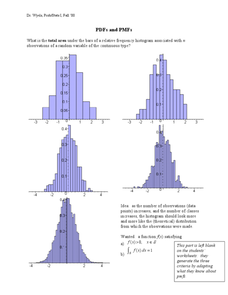
In this probability worksheet, students solve for the area under the frequency histograms. They identify the area using the derivative. There are 3 questions.
Curated OER
New York State Mathematics Exam
In this math instructional activity, students review for the exam given by the state of New York. There are 16 pages and 27 questions in this booklet covering topics from algebra, geometry and statistics.
Curated OER
The Handley Sports Problem
In this probability worksheet, 11th graders analyze how many students participate in four different sports using the probability of an event ocurring. There are 4 questions on this worksheet.
Curated OER
Mean Median and Mode
Young scholars collect data, graph it and analyze it. In this statistics lesson, students plot their data and calculate the mean, median and mode explaining how it relates to the data. They define the ways to find the mean, median and mode.
Mobile Education Store
SentenceBuilderTeen™
Have you seen a large number of grammatically incorrect sentences in class writing lately? Help alleviate that issue with this app, which is targeted toward teenagers. Class members look at age-appropriate images and choose the correct...
Mind Snacks
Learn Italian - MindSnacks
Once your class samples these games, they won't want to stop learning Italian. Eccellente! Effective for beginning and intermediate Italian learners, picking up new words and phrases through this app is an entertaining task.
Florida Department of Health
Safe and Happy: Safety for All at School and Online Unit
Bystander or upstander and advocate? Three lessons have high schoolers investigating data about bullying and school safety. Participants then learn how to take a stand against bullying and use what they have learned to create a PSA to...
Anti-Defamation League
Is Gaming a Boy's Club? Women, Video Games and Sexism
High school juniors and seniors investigate the representation of women in video games. They watch a video of researcher Anita Sarkeesian who describes the response to her research attempts, and read articles related to the topic. To...
Curated OER
Shooting Stats
Eighth graders discover the important role statistics play in sports and that appropriate data must be collected to do a statistical analysis. Students practice calculating statistics by charting a professional player of their choice.
Curated OER
How does Your Province Stack Up?
Young scholars investigate data about age, and sex of a population. In this statistics instructional activity, students are given data on a population to analyze and compare to other provinces. This assignment is part of a geography...
Curated OER
Great Tasting Shapes
Fifth graders investigate the concept of median, mode, and range using a simple model for display purposes. They examine different shaped crackers out of a box and identify the ones that occur the most. Then the calculations for the...
Curated OER
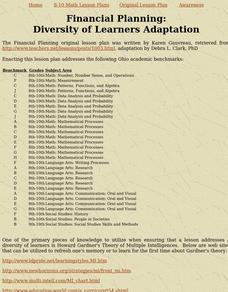
Financial Planning
Students participate in activities in order to apply the skills of sound financial planning that includes creating and maintaining a budget. The lesson is intended for diverse learners because of the application of The Multiple...
Curated OER
What is Probability?
Students participate in a variety of activities in order to understand the concept of probability. The students are engaged because of the application of The Multiple Intelligences Theory.
Curated OER
Pie Chart
For this literacy worksheet, students use the created resources for further progress towards knowledge. The sheet is a teacher's guide for creating student resources.
Curated OER
Pie Charts
In this math worksheet, students complete the work in order to chart the data into the pie graph. The picture is used for statistical analysis.
Curated OER
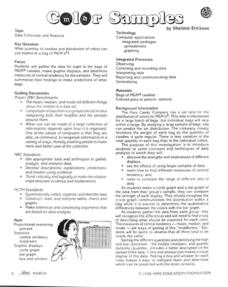
Colors Samples
In this math activity, students take the time to count out the colors of the candies. They graph the results and make inferences from the information.
Curated OER
Stem and Leaf Tables
In this math worksheet, students examine the order of the data set and create six different stem and leaf tables. The stem is the place value of ten and the leaf is the ones place.
Curated OER
School Population
In this math worksheet, students solve the problem of creating ratios for the school population. There is an example on page 1.
Other popular searches
- Baseball Stats
- Stats Minister
- Sports Stats
- Worksheets on Stats
- Water Pollution Stats
- Stats Sports Injury
- Bureau Stats
- Excel Football Stats
- Excel, Football Stats
- Baseball Stats Math
- Southeast Stats
- Universal Health Care Stats


