Curated OER
Pets Galore!
Fourth graders conduct a class survey on the number of pets that the 4th grade owns and they record that data in their math notebooks. They make a bar graph displaying the results using a spreadsheet through Microsoft Excel.
Curated OER
Surveys and Samples
In this surveys and samples learning exercise, middle schoolers discover data collection techniques and write their own survey questions. Students use random sampling, convenience sampling, and systemic sampling and analyze their...
Curated OER
Analyze a Survey
In this analyzing data worksheet, students read a tally chart regarding survey information and respond to 4 analytical questions regarding the data.
Curated OER
Survey Project
Eighth graders create a website using FrontPage. They use inserted forms to collect survey information and use Microsoft Excel and MS Word to create a presentation of the survey and the results.
Curated OER
Random Samples and Surveys
In this random samples worksheet, students answer 4 questions, including a bonus, regarding surveys and confidence intervals.
Curated OER
How do We Treat Our Environment?
Seventh graders explore the concept of collecting data. In this data collection lesson, 7th graders survey others about their environmental habits. Students graph their data.
Curated OER
Birthday Graph
For this birthday graph worksheet, students use the provided blank graph to plot information about birthday months. Students survey their classmates and record the results on the graph. Students answer 4 questions.
Curated OER
Candy Bar Survey
Second graders investigate the skill of graphing data by using candy bars to create context for the lesson. They use technology for graphing and organizing information like a spreadsheet. The lesson includes a resource link to aid in the...
Curated OER
Third Grade Math
In this math review worksheet, 3rd graders answer multiple choice questions about probability, bar graphs, pictographs, and more. Students complete 25 multiple choice questions.
Curated OER
Survey and Share
Students practice collecting data by surveying other students. For this data collection lesson plan, students decide on a question and collects data from 15 other students. Eventually the students will end up graphing their results.
EngageNY
Types of Statistical Studies
All data is not created equal. Scholars examine the different types of studies and learn about the importance of randomization. They explore the meaning of causation and when it can be applied to data.
Curated OER
Ice Cream
Learners explore the concepts of mean, median, mode, and range as they elicit data about people's favorite flavor of ice cream. A practical application of the data obtained offers an extension to the lesson plan.
Curated OER
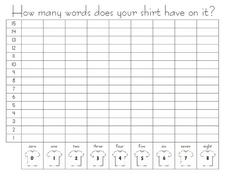
How Many Word Does Your Shirt Have on It? --class Bar Graph
In this math worksheet, students participate in a group bar graph activity. Students survey classmates about how many words, if any, are on their shirts. Results are plotted on a bar graph.
Illustrative Mathematics
Election Poll, Variation 1
Your class will learn what it means to take a random sample of a population and to draw inferences from the information gained. In part a, of the exercise, you discuss with your class how students during a class election can be best...
EngageNY
Estimating Probability Distributions Empirically 1
What if you don't have theoretical probabilities with which to create probability distributions? The 11th installment of a 21-part module has scholars collecting data through a survey. The results of the survey provide empirical data to...
Curated OER
The Appliance Explosion
Students explain why the number of appliances used today differs greatly from the number used previously. They construct a bar graph to show changes in appliance use over a period of time. They also list appliances that could be eliminated.
US Department of Agriculture
Agriculture Counts
Agricultural survey and the documentation of livestock or goods was the basis for the first written language. Youngsters discuss sorting and counting, and how these skills have been used for thousands of years. They accent their class...
Curated OER
Using Graphical Displays to Depict Health Trends in America's Youth
Identify the different types of graphs and when they are used. Learners will research a specific health issue facing teens today. They then develop a survey, collect and analyze data and present their findings in class. This is a...
Curated OER
El Salvador: Whose Breakfast Isn't for the Birds?
Sixth graders investigate the understanding of where coffee is grown by conducting a survey. They study the natural history of coffee and examine bird habitats in the areas where coffee is grown. They write letters to explaining the...
Michigan State University
In Search of Life
Explore the habitats around you with an activity that takes kids out of the classroom to learn about the local variety of habitats and the living things that call them home. In small groups, scholars investigate their surroundings,...
Curated OER
Rubber Band Banza
Third graders review ideas about sound and vibration to make their own stringed instrument. They review what a pictograph and bar graph are. Pupils conduct a survey within the classroom to choose the four favorite string instruments and...
National Security Agency
Going Green with Graphs
In this unit designed for second graders, youngsters are introduced to conducting surveys and creating tally charts based on the data they gather. Students then construct bar graphs, and observe the relationships between the two...
Math Worksheets Land
My Favorite Animal At The Zoo Pie Graph
What is your favorite animal at the zoo? Young mathematicians answer eight multiple choice questions, based on a survey of 50 people presented in a pie graph. Additionally, the graph does not display any numbers, but rather...
Curated OER
Environmental Agents of Mathematics: Mathematics for Change
High schoolers analyze environmental science data using Math. They do research about renewable energy, gather data, create graphs and interpret their findings. Then the group presents their arguments persuasively using their findings to...


