5280 Math
Multiplication Table Algebra
Patterns, patterns, everywhere! Young scholars examine the multiplication table to identify patterns. Their exploration leads to an understanding of the difference of squares and sum of cubes by the completion of the algebra project.
Corbett Maths
Median for a Frequency Table
Try to find the middle of a frequency table. Using a frequency table of ages, the video shows how to use a formula to determine the position of the median. The resource uses frequency tables with both even and odd numbers of data points.
Curated OER
Student Costs Data Table
Students compare and contrast two routes selected for a virtual field trip. They create a data table of educational activities, lodging, and meal costs using Microsoft Excel software.
Utah Education Network (UEN)
Linear Relationships: Tables, Equations, and Graphs
Pupils explore the concept of linear relationships. They discuss real-world examples of independent and dependent relationships. In addition, they use tables, graphs, and equations to represent linear relationships. They also use ordered...
Curated OER
Conversion Tables
Here are some practical conversion scenarios for scholars to figure out. They examine an example table converting cents to dollars before completing two of their own. For the first, learners convert weeks to days. Some of these are done...
DK Publishing
Using Information in Tables
Find out how well can your second or third graders use tables to solve word problems by assigning this single-page worksheet. Two tables with different sets of data prompt learners to solve six problems. An example at the top of the page...
Math Worksheets Land
Patterns of Association (Using Data Table) - Matching Worksheet
This resource is the last of a four-part series that practices calculating percents based on data represetned in tables. This page has four multiple choice problems that analyze the data tables to answer a question.
Charleston School District
Tables of Linear Functions
Don't forget the tables! The previous lessons in this five-part series examined the linear equation and graph relationship. The current lesson adds tables to the mix. At completion, individuals should be able to create a table of values,...
EngageNY
Calculating Conditional Probabilities and Evaluating Independence Using Two-Way Tables (part 2)
Without data, all you are is another person with an opinion. Show learners the power of statistics and probability in making conclusions and predictions. Using two-way frequency tables, learners determine independence by analyzing...
Math Worksheets Land
Patterns of Association (Using Data Tables) - Guided Lesson
The worksheet belongs to a four-part resource that applies percentages to data tables. The page has three practice problems that continues with the development of this topic.
EngageNY
From Ratio Tables to Equations Using the Value of a Ratio
Use the value of a ratio to set up equations. The teacher leads a discussion on determining equations from ratio tables in the 13th portion of a 29-part series. Pupils determine which of two equations to use to find the solution. They...
Curated OER
Filled Multiplication Table
In this multiplication table worksheet, students are given a 10 X 10 hundreds grid. The worksheet is a printable reference and learning tool.
Curated OER
Math Worksheet: Partially Filled Multiplication Table
In this multiplication learning exercise, students fill in 50 blank spaces in a partially filled multiplication table with facts from 1 to 10. This is an interactive online learning exercise that can be printed.
Curated OER
Graphing From Function Tables
In this graphing from function tables worksheet, students graph given functions from a completed function table. This is a worksheet generator, the teacher can set the grid size for plotting points as well as whether or not to include a...
Illustrative Mathematics
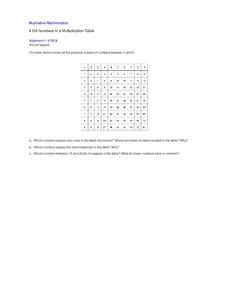
Numbers in a Multiplication Table
Identifying patterns is a crucial skill for all mathematicians, young and old. Explore the multiplication table with your class, using patterns and symmetry to teach about square numbers, prime numbers, and the commutative and identity...
Curated OER
Patterns in the Multiplication Table
Explore patterns in the multiplication table in order to deepen your third graders' understanding of this essential skill. Implement this activity as a whole-class lesson, allowing young scholars to work in pairs or small groups to...
Santa Barbara City College
How to Make a Multiplication Table
Teach children how to make a multiplication table, and they'll be multiplying for life. Following this series of steps, young mathematicians learn to use patterns and the relationships between numbers to create their very own...
Inside Mathematics
Conference Tables
Pupils analyze a pattern of conference tables to determine the number of tables needed and the number of people that can be seated for a given size. Individuals develop general formulas for the two growing number patterns and use them to...
CK-12 Foundation
Line Plots from Frequency Tables: Sleep Cycles
Demonstrate the ease of using a frequency table. An interactive lesson allows learners to create a frequency table efficiently. Challenge questions ask your classes to analyze the data represented in the frequency table.
Flipped Math
Calculus AB/BC - Estimating Limit Values from Tables
There's value in using a video to analyze a table of values. Pupils learn how to find the limit of a function from a table of values in the fourth of 18 lessons in Unit 1 - Limits and Continuity. An engaging video gives a tutorial on how...
CK-12 Foundation
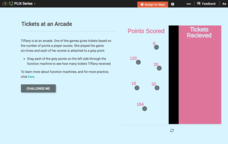
Function Rules for Input-Output Tables: Tickets at an Arcade
This is the ticket to learning about function rules! Using online manipulatives, scholars build a table of values and then answer questions about the related function. They examine the relationship between the input and output values and...
CK-12 Foundation
Input-Output Tables for Function Rules
How does changing a graph affect the function? Learners watch the changing input-output table as they adjust the location of the line graph. Questions prompt them to complete a table of values and determine the function rule.
CK-12 Foundation
Evaluate Limits Using Graphs and Tables: Where Is That Limit?
Limits are made easy through graphs and tables. An easy-to-use interactive lets users change a function on a coordinate plane. They relate graphs and tables to the limit at a specific value.
Curated OER
Use a Table
In this elapsed time activity, students analyze a schedule of events at a picnic with the starting times listed. Students read and solve 6 problems in which the elapsed time is calculated.
Other popular searches
- Periodic Table
- Multiplication Tables
- Math Tables and Tools
- Function Tables
- Chemistry Periodic Table
- Periodic Table of Elements
- Table of Contents
- Input/output Tables
- Multiplication Tables 1 100
- Frequency Tables
- Input Output Tables
- Data Table


