Curated OER
Mean, median, and mode... Use the data
Ninth graders participate in a instructional activity focused on the concept of basic statistics. They find the mean, median, and mode of different data sets. More advanced students could practice creating a bell curve from the data.
Curated OER
Plastic Packaging
Students collect data. In this math instructional activity, students collect data about recyclable materials. Students develop a plan that will help the environment. Recycling plastic containers is discussed.
Curated OER
Track and Field Olympics
Students practice the long jump, the triple jump, the shot put, the hammer throw, and the 50 yard sprint in a mock Olympic track and field competition.
Curated OER
Science: Observing Fish Behavior
Fifth graders, working in pairs, select and observe fish in the Aquademics aguarium. They record their observations on worksheets and make graphs displaying the frequency of various fish behaviors. Students then discuss their...
Curated OER
EMOTIONS AND GENDER EQUITY
Students discuss emotions and decide as a group which emotions are O.K. for males/females. They discuss solutions to gender bias in terms of the different emotions and write a reflective essay about what they learn from the discussion.
Curated OER
INFUSING EQUITY BY GENDER INTO THE CLASSROOM:A Handbook of Classroom Practices
Students examine how gender bias, stereotyping, and discrimination impacts their lives. Students examine behaviors they believe are acceptable for males and females and will compose an essay based on their findings.
Curated OER
Water Cycle: Weather Lesson 1
First graders go on a water walk, collect weather data, and measure rainfall for a month. They examine the water cycle in this series of lessons.
Curated OER
How Big Is It?
Fifth graders look at the Garrison flag and estimate how big it is. In this measurement lesson plan, 5th graders then calculate the area and perimeter of the flag.
Curated OER
Capture the Penguin
In this graphing worksheet, students play a game called Capture the Penguin where they put their penguins onto a graph with another player, roll dice to form ordered pairs, and start eliminating penguins. Students look at the scoring...
Curated OER
Water and Me
Young scholars name the ways in which they use water every day and create a counting book using the ways in which they use water to illustrate it. The measure and graph the amount of water they use when they wash their hands.
Curated OER
Mystery Puzzle Race
Students work on fitness in stations where they are assigned specific tasks (ex. jumping jacks) that must be performed as a group before moving on to the next station.
Curated OER
Escape The Hangman
Seventh graders investigate the concept of probability. They use the game of hangman to create engagement and context for conducting the lesson. They create a spreadsheet with data that is given. Students make predictions based on data.
Curated OER
Block Breakers
Learners throw bean bags at stacks of blocks. They record the results and write the corresponding mathematical equations.
Curated OER
Survey on Climate Change
In this climate change worksheet, learners read through the sentences and answer the questions that survey them about their knowledge of climate change.
Curated OER
Brainstorming for Consensus
Students practice brainstorming ideas about different topics. They discover how to come to a consensus about a given situation, by evaluating their brainstorming ideas.
Curated OER
The Great Backyard Bird Count
Students study new types of birds and explore how to keep a log of what they see.
Curated OER
Tagging Race
Students examine and identify plant parts to recognize specific weeds, identify three different weeds, discern differences in weeds quickly, evaluate classmates' weed recognition, and discuss what strategies they used to identify weeds.
Curated OER
Virtual Field Trip / Activity Research
Students visit a website to determine activities at three Michigan cities. They calculate the total cost of participating in the activities or visiting places such as zoos, planetariums, historic sites, and museums.
Curated OER
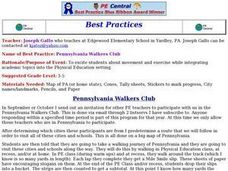
Pennsylvania Walkers Club
Students participate in an school-wide walking club. Students choose a destination in Pennsylvania they would like to visit. After plotting the best way to get their using a map, the walk each day and record their distance in miles on...
Curated OER
Boats Graph
Students read from the Bible about the travels of Paul, particularly the boat rides. They trace Paul's travels on a map of Asia Minor. Students review a field trip they took and make a graph showing the numbers of each type of boat they...
National Council of Teachers of Mathematics
Nctm: Illuminations: Grouping and Grazing
Help the alien spaceship move cows into corrals by counting, adding, and subtracting. This activity helps children learn grouping, tally marks, and place value.
Primary Resources
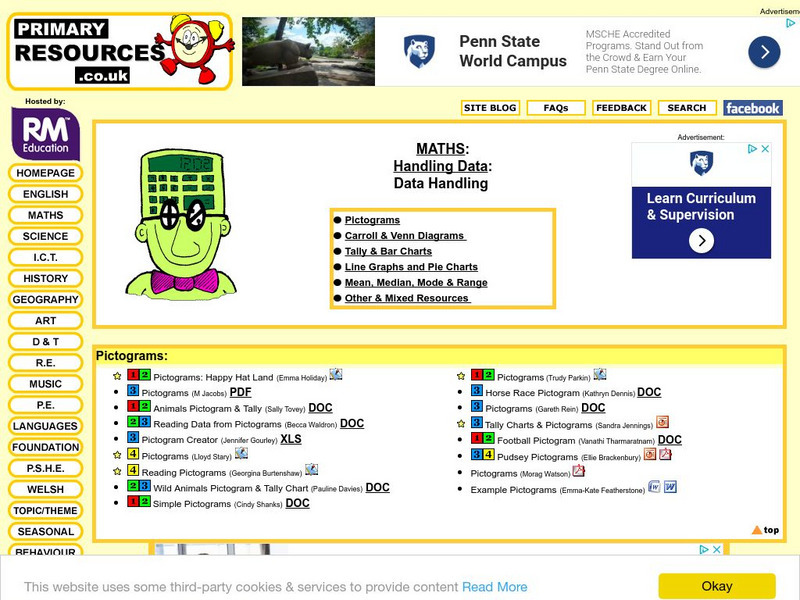
Primary Resources: Tally and Bar Charts
Lots of good materials for teaching about tally marks and bar graphs.
ClassFlow
Class Flow: Spring Activities
[Free Registration/Login Required] This April calendar is packed with activities: Calendar, rhyming, graphing, seasons sort and assessment. "Th", "ch", "wh," and "sh" sort and assessment, tally marks, addition, and counting Easter eggs.
Illustrative Mathematics
Illustrative Mathematics: Number of the Day
Repeatable, daily activities are one of the best ways to instill the counting sequence for children. This activity requires a 100 chart which can be made or purchased. Students will count the "Number of the Day" beginning with 1 on the...
Other popular searches
- Tally Marks Graph
- Math Tally Marks
- Graphing With Tally Marks
- Smart Board Tally Marks
- Math Tally Marks
- Tally Marks Lesson
- Tally Marks and Charts
- Counting Using Tally Marks
- Tally Marks and Frequency
- Probability Tally Marks
- Record Data Using Tally Marks
- Survey/ Tally Marks


