Curated OER
Our Favorite Pet
Students each have a turn, telling the class his or her favorite pet. The choices are cat, dog, fish or bird. Using the computer, the information from the tally be recorded on a spreadsheet and bar graph.
Curated OER
Handling Data: Collecting and Recording Data
Students collect and record data. In this collecting and recording data lesson, students collect data and record that data using frequency tables which include the x and y axis.
Curated OER
Coin Probability
Fourth graders, in pairs, receive three different types of coin bags. They pick coins out of the bag and tally what was picked fifteen times. They do it with all three bags for three separate tallies.
Curated OER
Growing Tomatoes
Second graders investigate the growth of tomatoes. They plant grape tomatoes and observe them. They write in a journal and take digital pictures of their tomato plants. They create bar graphs to tally the progress of their plants and...
Curated OER
Rice (Gohan) Observations
Second graders investigate rice or gohan as it's called in Japan in a couple of experiments. They tally the results.
Curated OER
1-2-3 Go!
Learners practice becoming fluent readers with timed repeated readings. They read passages for one minute and tally the number of words read. They repeat this process several times and count the number of words each time. They complete...
Curated OER
Working with Frequency Tables
In this Working with Frequency Tables worksheet, students analyze data that is organized in simple frequency charts. They calculate average from data presented in a frequency table, calculate a cumulative score, and identify data...
Curated OER
Chances Are
Upper graders examine the concept of probability. They collect data and create a bar graph. They must interpret the data as well. Everyone engages in hands-on games and activities which lead them to predict possible outcomes for a...
Environmental Protection Agency (EPA)
How Much Water Do You Use?
Incorporate reading strategies, math, research, and the scientific method into one lesson about water conservation. After reading a story about a landlady trying to determine how many people are living in an apartment, learners develop a...
Curated OER
Pop Tops
Get your class primed for a comparative analysis lesson plan with this activity. They compare and contrast their music preferences to those of their classmates. After reading an article, they identify current trends in popular music,...
Kelly's Kindergarten
May Daily Activities
Five weeks of daily activities for the month of May! With a new activity for each day of the month, your youngsters will utilize a variety of skills and practice everything from sight words and spelling to counting by twos or coloring...
Curated OER
Build a Bar Graph
Learners discover how to use bar graphs. They will gather and organize specific data in order to put it into a bar graph. Then they will answer several questions based on the information they have graphed.
Curated OER
October: Respect for Self and Others
Students realize their worth and dignity as human beings and account for their strengths as well as display their weaknesses. They display good manners and politeness, showing the respect for others as they would wish for themselves....
Curated OER
Tables and Graphs
Help pupils read graphs and tables with these examples and data comprehension questions. First they examine a bar graph to answer five analysis prompts. Note this graph doesn't have a label along the y-axis, so you may want to do this...
Curated OER
Partial Quotient
Students study what occurs in the division process, rather than just following prescribed steps. They expand number sense to include integers and perform operations with whole numbers, simple fractions, and decimals. They write a word...
Curated OER
Dental Detectives
First graders explore the theme of dental health and hygeine. They make tooth loss predictions, count lost teeth, and graph tooth loss. In addition, they listen to dental health stories, read online stories, create spreadsheets, and play...
Virginia Department of Education
Mathematics Vocabulary Cards - Kindergarten
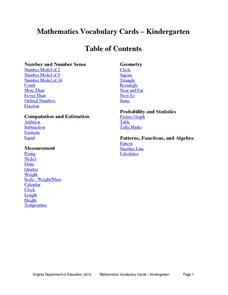
Enhance your math lesson with a series of pictures that illustrate different math concepts. The vocabulary includes a variety of ideas and pictures including fractions, ordinal numbers, picture graphs, and number lines.
Illustrative Mathematics
Find The Numbers 0-5 or 5-10
In need of math station or center for your kindergartners? Model how to play this game with the whole class first and then make it into a center. Create a few sets of six number cards with 0-5 or 5-10 and then create a matching die with...
Illustrative Mathematics
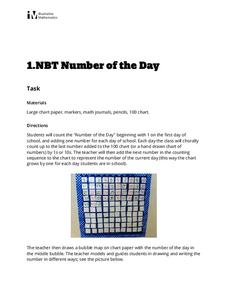
Number of the Day
Daily routines not only help to manage classrooms, they can also provide students with rich opportunities for learning. This activity supports young learners in developing their number sense by counting up the school days on a class...
Illustrative Mathematics
Comparing Numbers
Young mathematicians spin their way to a deeper number sense with this fun, collaborative activity. Using two spinners, one with the numbers 0-9 and the other with the decades 00-90, pairs of students take turns building and comparing...
Curated OER
First Grade Shoe Sizes
Third graders collect shoe size data from classmates in their room and another third grade. They predict what the most common shoe size will be. They place the data in an spreadsheet on the computer. They design a graph using the...
Curated OER
Excel Lesson Plan Coin Statistics
Second graders determine the difference between making a prediction and determining actual information. They design a spreadsheet for a coin flipping activity on which they include their predictions and what actual happens when they flip...
Curated OER
Spell, Shoot, Score!
Games are great ways to motivate. The class is split into two teams; each team earns points by correctly spelling given words. To score bonus points, teams get to shoot baskets with a small ball. Tip: This game could be used to reinforce...
Curated OER
Creating Tables and Bar Charts
A great way to introduce the concepts of data collection, bar charts, and data analysis. Learners see how their teacher used the data from fifty of her friends to construct a bar chart showing their favorite toys.
Other popular searches
- Tally Marks Graph
- Math Tally Marks
- Graphing With Tally Marks
- Smart Board Tally Marks
- Math Tally Marks
- Tally Marks Lesson
- Tally Marks and Charts
- Counting Using Tally Marks
- Tally Marks and Frequency
- Probability Tally Marks
- Record Data Using Tally Marks
- Survey/ Tally Marks


