Curated OER
Ketchup to Collecting Data
First graders collect data for a survey of 3 brands of ketchup and create class charts. They taste test three different brands of ketchup, and use the data to create a presentation. Tasty lesson!
Curated OER
An Apple A Day
Students create a graph that showcases their pick for favorite kind of apple. Students are given samples of a variety of apples to determine their favorite in a taste test. They a create a tally chart of favorite kinds apples and use a...
Curated OER
Pancakes, Pancakes!- Measuring
Students estimate measurements in real world problem situations. In this estimation lesson, students read the book Pancakes, Pancakes and estimate how many cups equal a pint, quart, and gallon. Students test their estimations by...
101 Questions
Nana's Lemonade
Consistency is the key. One lemon wedge per glass of water makes a nice glass of lemonade. Young scholars must identify the number of lemon wedges they need to make the same lemonade in a big gulp cup. They develop their own solution...
Curated OER
Apples Galore! (Elementary, Language)
Fifth graders examine and taste 7-8 difference apples, describe the flavor/texture, then graph the results of favorites. Finally students write a paragraph describing their favorite.
Captain Planet Foundation
Shape Shifters in the Math Garden
Combines mathematical measurement with gardening skills. Third graders hunt for worms in the garden and try to find the longest one. They also measure and weigh vegetables that they harvest from the garden, measure rainfall amounts, and...
Curated OER
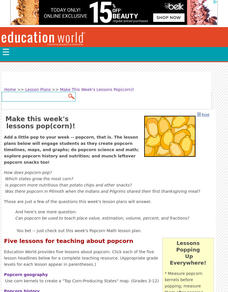
Make This Week's Lessons Pop(corn)!
Students create popcorn timelines, maps, and graphs; do popcorn science and math; explore popcorn history and nutrition; and munch leftover popcorn snacks too!,
Curated OER
Apples and Apple Activities
Young scholars investigate apples. In this reading comprehension lesson, students read a book about apples then compare and contrast, make graphs, distinguish between fact and fiction and work in groups. Young scholars work in groups to...
Curated OER
Emperical Probability
In this statistics and probability worksheet, students determine the experimental probability of an event occurring. The two page worksheet contains a combination of nine multiple choice and free response questions. Answers are provided.
Curated OER
Data and Probability: What is the Best Snack?
In this math/nutrition lesson, the nutritional value of 3 snack foods is recorded on a data chart and represented on a bar graph. Students analyze and compare information, construct data charts and related bar graphs, and draw...
Statistics Education Web
Walk the Line
How confident are you? Explore the meaning of a confidence interval using class collected data. Learners analyze data and follow the steps to determine a 95 percent confidence interval. They then interpret the meaning of the confidence...
Curated OER
Jelly Bean Math Activities
Using jelly beans as math manipulatives can be a tasty way to introduce and reinforce math concepts. Regardless of the time of year, candy can be used to excite learners and facilitate a wide variety of mathematical concepts.
Statistics Education Web
You Will Soon Analyze Categorical Data (Classifying Fortune Cookie Fortunes)
Would you rely on a fortune cookie for advice? The lesson first requires future statisticians to categorize 100 fortune cookie fortunes into four types: prophecy, advice, wisdom, and misc. The lesson goes on to have learners use...
Curated OER
Table Interpretation
Students solve problems using graphs to list and interpret data. Each student construct his or her own graph using art paper and markers. They be given a set of information to apply to their graphs and interpret their findings.
Curated OER
The Great Chile Challenge
Fifth graders gather data, create a graph, and interpret information. They build vocabulary by negotiating the ideas that go into the graphs which they create. They use Excel to print a variety of graphs based on how much they like Chile...
Curated OER
Aqua-Thrusters!
Students construct their own rocket-powered boat called an "aqua-thruster." These aqua-thrusters will be made from a film canister and will use carbon dioxide gas - produced from a chemical reaction between an antacid tablet and water -...
Curated OER
Math, Music and Architecture: Kindergarten Geometry and Aesthetics in Music and Architecture
Students identify and name different geometrical shapes. In this math lesson plan, students distinguish odd from even numbers. They describe the properties of 2 and 3 dimensional objects.
Curated OER
Acceptance Sampling
For this algebra lesson, learners sample food and identify acceptance sampling. They create specific plans to meet specific situations as they sample the food. There are 6 questions.
Curated OER
Introducing Models to Elementary School Students
Students explore the concept of models. In this model lesson, students examine 3-dimensional models of various objects and body parts to better understand the natural world.
Other popular searches
- Food Taste Test
- Applesauce Taste Test
- Apple Taste Test
- Scientific Method Taste Test
- Water Taste Test
- Taste Test Tongue
- Taste Test Marketing
- Taste Testing Activity
- Cookie Taste Test
- Marketing Soda Taste Test
- Taste Test for Bias
- Taste Testing


