Curated OER
Feature column: Hands on Math With Technology
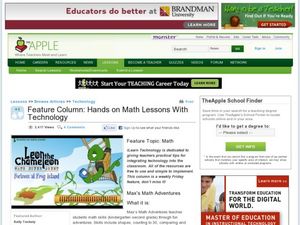
Young learners will view a math adventures video and practice math concepts. Afterwards they will navigate through Internet sites to participate in teacher selected math adventures. This guide walks you through integrating technology...
NASA
Hurricanes and Hot Towers with TRMM
Take cover because a wild presentation on hurricanes is about to make landfall in your classroom! An outstanding PowerPoint presentation is the centerpiece of this lesson. Not only does it provide information and photographs, but several...
New York State Education Department
TASC Transition Curriculum: Workshop 2
Flipped classrooms and online tools killed the chalkboard! An awesome, hands-on technology workshop asks teachers across all content areas. to examine model lessons, become familiar with research, and explore tech tools they can...
New York State Education Department
TASC Transition Curriculum: Workshop 3
Teachers turning into high schoolers? It's not Freaky Friday! It's a thoughtful workshop that teaches participants how to plan professional development for staff. Third in a 15-part series, the workshop provides a platform for the other...
EngageNY
TASC Transition Curriculum: Workshop 15
What do a cheetah, Audi commercial, and air have in common? They're all topics of an engaging inquiry-based, hands-on workshop for educators about background knowledge, reading strategies, the CER model, and argumentative writing. The...
Curated OER
Data Analysis Using Technology
Analyze data using technology. Middle schoolers design data investigations, describe data, and draw their own conclusions. Then they select the best type of graph, graph and interpret the data, and look for patterns in trends. They also...
Curated OER
The Ultimate Classroom: R & D
Redecorate a classroom on a budget. Middle schoolers rebuild a classroom after a disaster. They conduct Internet research to determine construction supplies needed and the most cost effective way to reach the predetermined results. They...
Curated OER
Murder in the First Degree - The Death of Mr. Spud
Secondary learners investigate exponential functions in a real-world scenario. They collect data on the temperature of a cooling baked potato, enter the data into lists, and graph the data using a scatter plot before finding an...
National Security Agency
Line Plots: Frogs in Flight
Have a hopping good time teaching your class how to collect and graph data with this fun activity-based lesson series. Using the provided data taken from a frog jumping contest, children first work together creating a line plot of the...
Curated OER
Using Measurement in the Everyday World
Students use an appropriate unit of measure to measure an item in the classroom. They create a PowerPoint to demonstrate the measurement process. Pupils are divided into pairs. Students use a concept map to discuss the terms for...
EngageNY
TASC Transition Curriculum: Workshop 9
Here's a workshop for teachers that rocks the academic world! Using earthquakes as a medium for instruction, educators learn about crosscutting engineering with science. Fun, hands-on, collaborative exercises encourage participants to...
Howard Hughes Medical Institute
Lesson 8: WildCam Gorongosa Data Analysis
How do scientists analyze data to get a specific answer to a question? The final chapter in an eight-part series of activities centered around Gorongosa National Park encourages scholars to dig deeper into the scientific process. After...
Curated OER
Polygons in Real Life
Fourth graders identify and label different types of polygons in real life situations. Using a digital camera, they take pictures of polygons on the school grounds, tally the number of shapes found, and answer discussion questions.
West Contra Costa Unified School District
Correlation and Line of Best Fit
Computers are useful for more than just surfing the Internet. Pupils first investigate scatter plots and estimate correlation coefficients. Next, they use Microsoft Excel to create scatter plots and determine correlation coefficients and...
Mascil Project
Design and Build Your Own Vacuum Cleaner, Hair Dryer or Toy Car
No vacuum cleaner? No problem, just build your own. Scholars apply knowledge of currents to build a model of either a vacuum clear, a hair dryer, or a toy car. While the class completes the activity, instructors consider gender...
Teach Engineering
Floaters and Sinkers
Whatever floats your boat. Young engineers learn about density by measuring the masses and volumes of boxes filled with different materials. Using their knowledge of densities, they hypothesize whether objects with given densities will...
EngageNY
Definition of Translation and Three Basic Properties
Uncover the properties of translations through this exploratory lesson. Learners apply vectors to describe and verify transformations in the second installment of a series of 18. It provides multiple opportunities to practice this...
Curated OER
Teamwork and Productivity: Building a Better "What's It"
Students produce products and calculate their group's profit or loss. In this productivity lesson, students work as a team to produce products at specific specifications for a pretend company. At the end of the time limit, they compute...
Curated OER
Angles
Learners identify obtuse and acute angles in comparsion to a right angle. They identify obtuse, acute, and right angles. Pupils use "Shape Measure" to construct obtuse, acute, and right angles. They review line segements to locate right...
Curated OER
Border Patrol ID: 11603
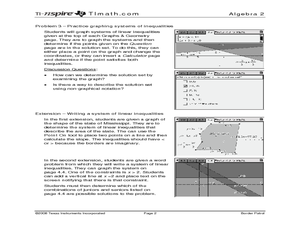
Incorporate technology in your classroom by teaching your students how to graph systems of linear inequalities as they apply to an area of land. The lesson provides an extension in which students are challenged to write a system of...
Curated OER
Beginning Graphs in MS Excel
Students practice creating graphs in Microsoft Excel. In this technology lesson, students conduct a random survey and collect data. Students use the Microsoft Excel program to create a bar graph of the data.
Curated OER
How to Graph in Excel
Fourth graders construct data graphs on the Microsoft Excel program. In this statistics lesson, 4th graders formulate questions and collect data. Students represent their results by using Excel.
Agriculture in the Classroom
A Holiday Tradition: Which Christmas Tree Will You Choose?
Different varieties of Christmas trees provide an interesting way to combine social studies, science, math, and technology. Class members not only research the history of the Christmas tree holiday tradition, they compare and contrast...
National Council of Teachers of Mathematics
National Debt and Wars
Take a functional approach to the national debt. Learners collect information about the national debt by decade and plot the data. They determine whether an exponential curve is a good fit for the data by comparing the percent changes...


