Chicago Botanic Garden
Micro-GEEBITT Climate Activity
A truly hands-on and inquiry based learning activity bridges all the lessons in the series together. Beginning with a discussion on average global temperatures, young meteorologists use real-world data to analyze climate trends in order...
Curated OER
Animal Science - Body Temperature
Young scholars use the TI-83 + linked to the CBL2 and temperature probes to perform an experiment. Each of the temperature probes is placed into a different cup, one insulated and one not insulated. Each cup holds warm water. The two...
Curated OER
Water Chestnut Graphing Activity
Students are taught how to format and enter data into an Excel spreadsheet. They make a graph and interpret graphed data. Students discuss possible impacts of water chestnut invasion. They graph data on water chestnut. Students report...
NOAA
Ocean Layers II
Now that you know the ocean has layers, let's name them. The seventh installment of a 23-part NOAA Enrichment in Marine sciences and Oceanography (NEMO) program covers terminology associated with ocean layers, such as thermocline and...
Concord Consortium
Charged and Neutral Atoms
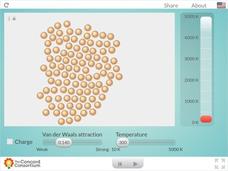
Do charged and neutral particles behave differently as they undergo phase changes? Science sleuths examine two types of attractive forces using an informative interactive. Pupils can vary the amount of Van der Waals attraction present...
Concord Consortium
Specific Heat and Latent Heat in Condensation
There's more to melting than meets the eye! Junior physical chemists investigate the differences between specific and latent heats as a substance undergoes a phase change. Users remove heat from the system and observe changes in kinetic...
Curated OER
Global Warming - The Heat is On: Global Climate Change Revisited
After listening to your lecture on climate change, young scientists access NOAA's database listing Mauna Loa's carbon dioxide data. They graph the monthly means and then compare their graphs to NOAA's. This is a concise plan that could...
Rainforest Alliance
Climate Educator Guide
Climate change is a hot topic in the news. Class members examine carbon dioxide data to analyze trends of our atmospheric makeup over time. They also discuss climate and climate change, and determine how these changes are affecting life...
National Wildlife Federation
The Tide is High, but I’m Holding On… Using ICESat Data to Investigate Sea Level Rise
Based on the rate of melting observed from 2003-2007 in Greenland, it would take less than 10 minutes to fill the Dallas Cowboys' Stadium. The 17th lesson in a series of 21 has scholars use the ICESat data to understand the ice mass...
Curated OER
A Day at the Beach
Help learners determine the rate of change for the temperature of sand. They will collect data on the temperature of wet and dry sand over time with a heat lamp overhead. Then make a scatter plot of the data and find a linear model to...
Curated OER
Moo-Velous Butter!
Third graders investigate how temperature and motion (energy) create a chemical change that turns cream ( a liquid) into butter (a solid). They create a class pictograph of their favorite mils choices (white, chocolate, or strawberry)...
Curated OER
How Does Water Cool?
How fast does water cool? First fifth graders will draw a line on a graph that predicts how fast they think water can cool from boiling. Then they plot the actual data on the same graph to see if their estimate was correct.
Curated OER
Busted Bubbles
Using the scientific method, and bubble gum, learners conduct a motivating experiment. After conducting a series of tests involving bubble gum, they graph and analyze their results. This is the type of activity everyone loves.
Wild BC
Greenhouse Gas Line-Up
Discuss different sources of energy and how much greenhouse gas each might emit. The six sources are then ranked according to emissions from greatest to least. Finally, the true cumulative emissions are revealed to show the class how...
Curated OER
My Angle on Cooling
Students explore how the angle and distance of an object can change it's temperature. After reviewing how the position of the Earth affects the temperature of the planet, student groups design and perform an experiment to test how...
Curated OER
Chemistry Review
For this chemistry review worksheet, students identify chemical changes, isotopes, ions, and chemical bonds. This worksheet has 32 multiple choice questions.
Curated OER
Radiation Comparison Before and After 9-11
Using the NASA website, class members try to determine if changes could be detected in cloud cover, temperature, and/or radiation measurements due to the lack of contrails that resulted from the halt in air traffic after the attacks of...
Curated OER
Rates of Chemical Reactions-The Iodine Clock Reaction
Learners investigate the reaction rate of iodine and soluble starch. For this rates of chemical reactions lesson plan, students study the effects of varying concentrations of reactants and varying temperatures of reactants on the...
Texas State Energy Conservation Office
Investigation: Insulation
Youngsters compare the heat-holding abilities of three different cans by insulating two with different materials and measuring the temperature change of hot water over a 20-minute period.
Curated OER
Heating Curve
Wow! This is a nifty presentation for teaching high school chemists about the heating curve. It displays a graph for temperature vs. heat added, then enters the curve itself. The final slide identifies each part of the curve. Notes are...
Wild BC
Bearly Any Ice
After reviewing food chains, your class members participate in an arctic predator-prey game that exemplifies the impact of climate change of food availability. If you are in a hurry, skip this instructional activity, but if you have the...
Chicago Botanic Garden
Albedo, Reflectivity, and Absorption
What is reflectivity, and what does it have to do with the Earth's climate? As reflectivity is measured by albedo, scientists can gather information on Earth's energy balances that relate to global warming or climate change. Budding...
Global Change
Impact of Climate Change on the Desert Pupfish
A fish that lives in the desert? You and your class can meet the desert pupfish as they examine its habitat, the role humans play in diminishing water supplies, and how climate change might impact this fishy friend. There are four short...
Curated OER
Changing Planet: Sea Levels Rising
Begin by showing a six-minute video, Changing Planet: Rising Sea Level as an anticipatory set. Pupils draw a topographic map of a potato continent. Finally, they will visit NOAA's sea levels online map and NASA's carbon dioxide...


